Rationale
Obesity is associated with heart disease, diabetes, stroke, high blood pressure and some cancers. The increase in the prevalence of obesity has been identified as a major cause of the projected increase in diabetes.27
Current Level and Trends
In 1997, 17 percent of adults aged 15 and over were obese (15 percent of adult males and 19 percent of adult females). In 2002, 10 percent of children aged 5-14 years were obese.
In New Zealand, obesity is becoming increasingly common, with a 50 percent increase in adult obesity from the late 1980s to the mid-1990s. In 1989/1990, obesity was found in 10 percent of adult males and 13 percent of adult females.28
Internationally, increasing levels of obesity are related to social changes, including easier access to foods high in fat and energy, shifts towards less physically demanding work, increased use of automated transport, labour-saving technology in the home, and passive leisure.
Figure H6.1 Proportion of the population
aged 15+ who are obese, by age group & sex, 1997
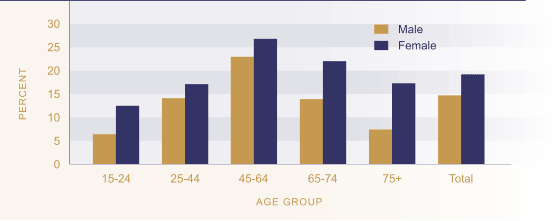
Source: Ministry of Health
(1999d) p170. Rates for 15-24-year-olds derived by Ministry of Health.
Age and Sex Differences
Obesity increases with age, peaking at the 45-64 year age group (23 percent for males, 27 percent for females), then declining at the older age groups. This age pattern may reflect in part a cohort effect. Adult females are more likely than adult males to be obese. This pattern is also evident among children aged 7-14 years. The sex difference in obesity is greatest at ages 65 years and over.
Ethnic Differences
Māori and Pacific people have higher rates of obesity than other ethnic groups. Among adults in 1997, 28 percent of Māori females and 27 percent of Māori males were obese. For Pacific adults, the figures were 47 percent for females and 26 percent for males. This compares with 17 percent for European/Other females and 13 percent for European/Other males. Among children aged 5-14 in 2002, there was a similar pattern (Pacific children: 31 percent and 26 percent for females and males respectively; Māori children: 17 percent, 16 percent; European/Other: 6 percent, 5 percent).
Figure H6.2 Proportion of the population
aged 15+ who are obese, by sex & ethnic group, 1997
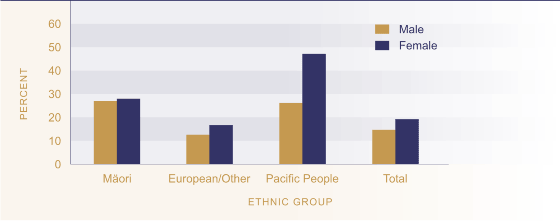
Source: Ministry of Health
(1999d) p171
Table H6.1 Obesity prevalence rates, Māori, non-Māori, 1989/1990, 1997
| 1989/1990 | 1997 | |||
|---|---|---|---|---|
| Māori % | Non-Māori% | Māori % | Non-Māori % | |
| Male | 19.3 | 8.7 | 27.2 | 13.1 |
| Female | 20.0 | 12.2 | 27.9 | 18.1 |
Source: Ministry of Health
(1997) and Russell and Wilson (1991)
Note: Rates are age-standardised using the WHO world population.
Socio-Economic Differences
For females, there is an association between obesity and the level of deprivation in the area where people live. Females living in the least deprived quartile of small areas in New Zealand had the lowest level of obesity (13.1 percent), while those in the most deprived quartile had the highest level (25.4 percent). This relationship was not statistically significant for males.29
International Comparison
New Zealand has a relatively high prevalence of obesity compared with other OECD countries, with a rate of 17 percent in 1997, compared to an OECD median of 11.5 percent. New Zealand ranked poorly at twenty-second out of 27 countries in the late 1990s. The United States had the worst rate of obesity (31 percent in 1999). The United Kingdom (22 percent in 2001) and Australia (21 percent in 1999) also had higher obesity rates than New Zealand, while the rate in Canada was slightly lower (15 percent in 2001). Japan has the lowest prevalence of obesity (3 percent in 2001).31