Safety
Fear of crime
Definition
The proportion of the population aged 15 years and over who felt “safe” or “very safe” walking alone in their neighbourhood after dark.
RelevanceTop
Anxiety and worries about victimisation can detract from wellbeing, and may cause people to alter their behaviours to avoid being victimised. This limits people's options and can reduce their freedom.
Current levelTop
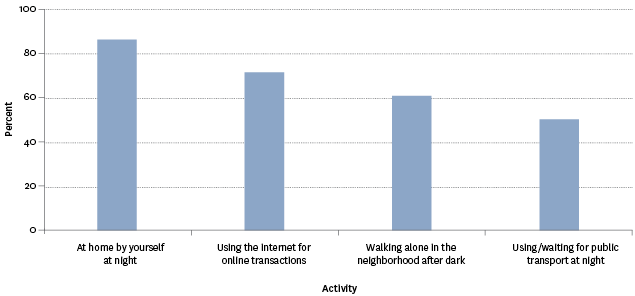
In comparison, a higher proportion felt safe or very safe being at home by themselves at night (86.4 percent), or when using the internet for online transactions (71.6 percent). Waiting for or using public transport such as buses and trains at night was rated the lowest, with 50.2 percent of people feeling safe or very safe doing this.
Figure SS2.1 – Proportion of population aged 15 years and over who felt safe or very
safe doing various activities, 2014
Source: Statistics New Zealand, New Zealand General Social Survey
Age and sex differencesTop
In 2014, females were much less likely than males to feel safe or very safe walking alone in their neighbourhoods after dark (44.1 percent of females compared with 77.8 percent of males). One-third of females (35.2 percent) reported feeling unsafe or very unsafe doing this activity compared with 9.2 percent of males.
Compared with other age groups, those aged 65 years and over were least likely to feel safe or very safe (53.6 percent) walking alone in their neighbourhood after dark. Women aged 65 years and over were particularly less likely to feel safe or very safe (32.9 percent). Those in the 45–54 year age group (66.1 percent) were most likely to feel safe or very safe doing this.
Table SS2.1 – Proportion of population aged 15 years and over by feelings of
safety about walking alone in the neighbourhood after dark, by age group and sex, 2014
| Very safe/Safe | Neither | Unsafe/Very unsafe | |
|---|---|---|---|
| Male | |||
| 15–24 | 77.7 | 12.8 | 9.4 |
| 25–34 | 76.1 | 14.4 | 9.5 |
| 35–44 | 76.3 | 14.8 | 8.9 |
| 45–54 | 84.0 | 9.7 | 6.4 |
| 55–64 | 79.1 | 11.1 | 9.9 |
| 65+ | 73.1 | 15.6 | 11.4 |
| Female | |||
| 15–24 | 41.5 | 23.9 | 34.5 |
| 25–34 | 45.4 | 21.5 | 33.0 |
| 35–44 | 47.9 | 21.5 | 30.6 |
| 45–54 | 49.2 | 17.2 | 33.6 |
| 55–64 | 45.9 | 19.7 | 34.5 |
| 65+ | 32.9 | 20.7 | 46.4 |
| Total | |||
| 15–24 | 60.4 | 18.2 | 21.5 |
| 25–34 | 60.7 | 18.0 | 21.3 |
| 35–44 | 61.7 | 18.3 | 20.1 |
| 45–54 | 66.1 | 13.5 | 20.4 |
| 55–64 | 62.4 | 15.4 | 22.2 |
| 65+ | 53.6 | 18.1 | 28.3 |
Source: Statistics New Zealand, New Zealand General Social Survey
Ethnic differencesTop
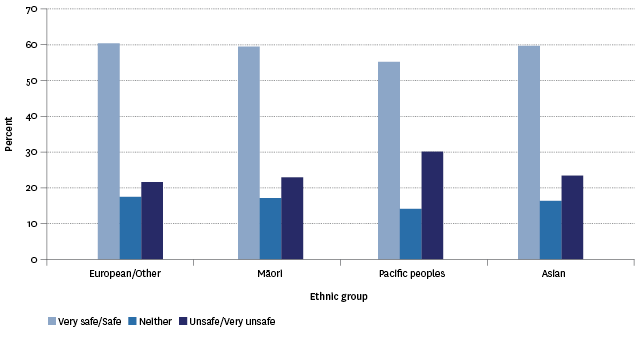
In 2014, Pacific peoples were less likely than other ethnic groups to feel safe or very safe walking alone in the neighbourhood after dark (55.5 percent). Around 60 percent of people who identified as European/Other, Māori or as part of the Asian ethnic group felt safe or very safe.
Figure SS2.2 – Proportion of population aged 15 years and over by feelings of safety
about walking alone in their neighbourhood after dark, by ethnic group, 2014
Source: Statistics New Zealand, New Zealand General Social Survey
Socio-economic differencesTop
The proportion of people feeling safe or very safe walking alone in their neighbourhood after dark increased as material wellbeing increased. In 2014, 71.3 percent of people in the higher material wellbeing index category felt safe or very safe, compared with 47.5 percent of people in the lower material wellbeing index category. The satisfaction levels for people in the lower middle material wellbeing index category and upper middle category were 54.4 percent and 61.1 percent respectively.
A similar pattern was found when looking at personal income: 77.2 percent of people with a personal income over $70,000 felt safe or very safe walking alone in their neighbourhood after dark, compared with 53.1 percent of people with a personal income of $30,000 and under, and 63.9 percent of people with a personal income between $30,001 and $70,000.
Labour force status differencesTop
In 2014, those who were employed (65.1 percent) were more likely to feel safe or very safe walking alone in their neighbourhood after dark, compared with people who were unemployed and those not in the labour force (eg retired, studying, caring for others (51.6 percent each)).
Family type differencesTop
People living in sole-parent families were less likely to feel safe or very safe walking alone in their neighbourhood after dark (49.0 percent), compared with other family types – people living in a couple with children family type (64.9 percent); people living in a couple with no children family type (61.0 percent); and people not in a family nucleus (58.4 percent).
Migrant status differencesTop
In 2014, migrants who had arrived in New Zealand in the last five years (71.3 percent) were slightly more likely than longer-term migrants (62.3 percent) and people born in New Zealand (59.9 percent) to feel safe or very safe walking alone in their neighbourhood after dark.
Regional differencesTop
Southland (75.4 percent) and Otago (71.4) had the highest proportions of people who reported feeling safe or very safe walking alone in their neighbourhood after dark. Manawatu-Wanganui (53.3 percent) and Northland (53.9 percent) had the lowest proportions.
International comparisonTop
OECD country comparisons can be made by looking at the proportion of people who felt safe while walking alone at night in the 2012 Gallup World Poll.
New Zealand (66.5 percent) was below the OECD mean of 72.2 percent and the OECD median of 73.8 percent, and was also lower than Australia (68.0 percent), the United States (74.8 percent), and the United Kingdom (76.1 percent).
Norway had the highest proportion of people who felt safe while walking alone at night, at 88.9 percent, while Greece had the lowest proportion at 46.7 percent.
Data for this section can be found at: www.socialreport.msd.govt.nz/documents/2016/ss2.xlsx
