Workplace injury claims
Definition
The number of workplace accident insurance claims reported to the
Accident Compensation Corporation (ACC) per 1,000 full-time equivalent
employees, excluding those employees who received accident and
emergency treatment only.
Relevance
Safety at work is an important contributor to wellbeing and
the risk of work-related accidents or illness can be seen as one
component of the quality of work. The best currently available measure
of the incidence of workplace injuries comes from the database of
claims made to the ACC.
Current level and trends
Provisional data for the 2006 calendar year shows 235,200
work-related injury claims had been reported to the ACC by 31 March
2007. This represents a rate of 126 claims per 1,000 full-time
equivalent employees (FTEs), lower than the provisional rate for the
previous year based on claims reported by 31 March 2006 (132 per 1,000
FTEs).
Using final data for the years 2001 to 2005, the injury claim
rate declined from 143 per 1,000 to 134 per 1,000 FTEs.
Figure PW4.1 Estimated claim rate per
1,000 full-time equivalent employees, by sex, 2001–2006
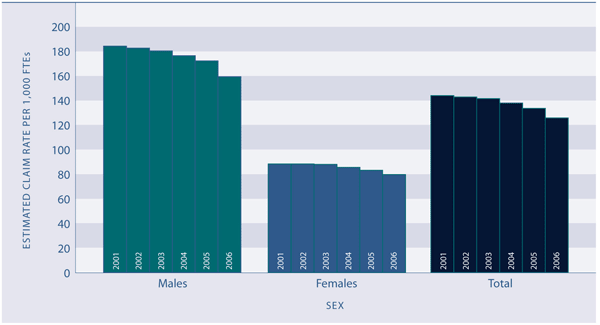
Source: Statistics New Zealand (2007c)
Note: 2006 data is provisional and subject to change
The majority (89 percent) of injury claims for 2006 reported
by March 2007 were for medical treatment only (ie not including weekly
compensation or other entitlements). Eighty-three percent of the claims
were for employees, and people who employed others in their own
business. The injury claim rate for the selfemployed not employing
others was much higher than for the rest of the workforce (187 per
1,000 FTEs compared with 118 per 1,000 FTEs).
Injury claims for 2006 reported by March 2007 included 81
work-related fatalities. This is likely to be an underestimation of the
final number of fatalities, because some workers may have died later
from injuries received in the period. For example, the number of claims
for fatal injuries inflicted in 2005 that were recorded by March 2006
was 86; the final number of fatal injury claims for 2005 was 92.
Moreover, not all fatal work-related accidents result in a claim to the
ACC.
Age and sex differences
Provisional 2006 data shows that males were around twice as
likely as females to suffer workplace injuries involving a claim to the
ACC (159 per 1,000 FTEs for males compared with 80 per 1,000 FTEs for
females). This reflects in part a male predominance in relatively
dangerous occupations (eg elementary occupations, agriculture and
fishing, and plant and machine operating and assembly, where the injury
claim rates were 277, 259 and 243 per 1,000 FTEs respectively in 2006).
Although workers aged 65 years and over made only 4 percent of injury
claims, they had the highest injury incidence rate of 199 claims per
1,000 FTEs. The next highest injury incidence rate was recorded for
those aged under 25 years (149 per 1,000 FTEs). Age differences in
injury claim rates for females were less pronounced than those for
males.
Figure PW4.2 Estimated injury claim rate
per 1,000 full-time equivalent employees, by age and sex, 2006
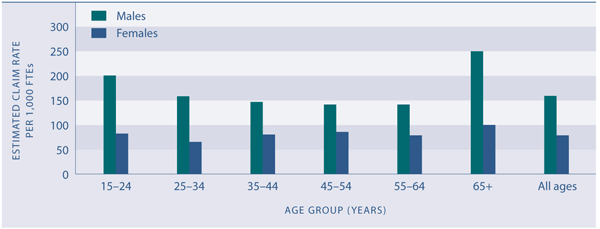
Source: Statistics New Zealand (2007c)
Note: 2006 data is provisional and subject to change
Ethnic differences
Workplace injury claim rates are higher for Māori and Pacific
peoples than for other ethnic groups (165 per 1,000 FTEs and 149 per
1,000 FTEs respectively in 2006). This reflects their
over-representation in more dangerous occupations. In 2006, the injury
claim rate for the Other ethnic group (including Asian) was 133 per
1,000 FTEs. The rate was lowest for Europeans (114 per 1,000 FTEs).
Table PW4.1 Workplace injury claims, by
ethnicity, 2006
| Ethnic group |
Number of claims |
Rate per 1,000 FTEs |
| European |
162,900 |
114 |
| Māori |
29,400 |
165 |
| Pacific peoples |
12,900 |
149 |
| Other (including Asian) |
24,500 |
133 |
| Total |
235,200 |
126 |
Source: Statistics New Zealand (2007c)
Table 2
Notes: (1) Data is provisional (2) Total includes ethnicity not
specified
Industry differences
The agriculture, forestry and fishing industries group had the
highest injury claim rates in 2006, with 177 claims per 1,000 FTEs.
There were also relatively high rates in the mining and manufacturing
industries (both 165 claims per 1,000 FTEs) and in construction (152
per 1,000 FTEs). However, mining accounted for less than 1 percent of
full-time equivalent employees in 2006, while manufacturing and
construction employed more than a fifth (23 percent) of all full-time
equivalent employees. The lowest injury claim rate was for people
working in finance and insurance (19 per 1,000 FTEs). In 2006, the
work-related fatality rate was highest for the agriculture, forestry
and fishing industries group (15 per 1,000 FTEs) followed by
construction (13 per 1,000 FTEs).
Regional differences
The highest work-related injury claim rates in 2006 were in
the Bay of Plenty and Gisborne/Hawke’s Bay, with rates of 174 and 171
claims per 1,000 FTEs, respectively. Wellington had the lowest rate of
69 claims per 1,000 FTEs. |
