| Introduction | | People | | Health | | Knowledge & Skills | | Paid Work | | Economic Standard of Living | | Civil & Political Rights |
| Cultural Identity | | Leisure & Recreation | | Physical Environment | | Safety | | Social Connectedness | | Summary | | Notes & References |
DownloadLeisure & Recreation - PDF, 85kb |
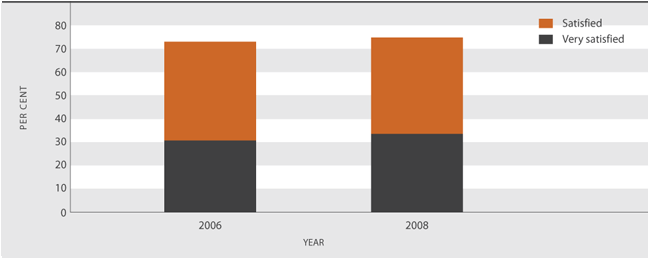
Satisfaction with leisure timeDefinitionThe proportion of people aged 15 years and over who are "satisfied" or "very satisfied" with their leisure time as reported in the Quality of Life Survey. RelevanceLeisure time is a crucial component of a balanced and healthy lifestyle. It is a time when people can do what they want to, separate from work and other commitments. Current levelIn 2008, three-quarters of New Zealanders (75 per cent) were satisfied overall with their leisure time. Of these, 41 per cent were satisfied and 34 per cent were very satisfied. These results are very similar to those in 2006, when 73 per cent of New Zealanders were satisfied with their leisure time (42 per cent satisfied and 31 per cent very satisfied). Figure L1.1 Satisfaction with leisure time, 2006 and 2008
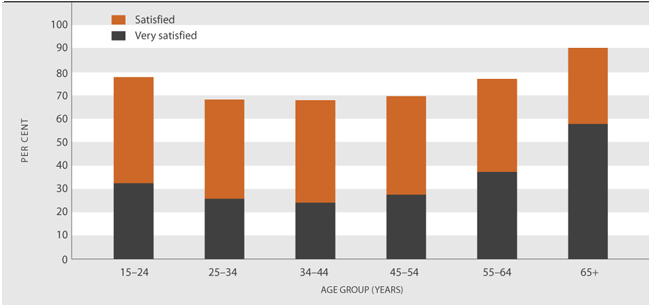
Source: Quality of Life Survey 2006; Quality of Life Survey 2008 Age differencesWhile the majority of New Zealanders were satisfied with their leisure time, those aged 25–34 years (68 per cent), 35–44 years (68 per cent) and 45–54 years (70 per cent) were less satisfied overall. These age groups tend to have larger work and family commitments than other groups, which may impinge on the time available for leisure. In comparison, those aged 15–24 years and those aged 55–64 years were more likely to report being satisfied with their leisure time, with total satisfaction levels of 78 per cent and 77 per cent respectively. People aged 65 years and over reported the highest levels of overall satisfaction with their leisure time (90 per cent). Figure L1.2 Satisfaction with leisure time, by age, 2008
Source: Quality of Life Survey 2008 Sex differencesThere was little difference between males and females in reported satisfaction with leisure time. Seventy-four per cent of men and 76 per cent of women reported they were satisfied or very satisfied with their leisure time. Ethnic differencesMost New Zealanders, regardless of their ethnicity, were satisfied with their leisure time. In 2008, the European ethnic group (76 per cent), Māori (75 per cent) and Pacific peoples (74 per cent) had similar levels of satisfaction with their leisure time, while people of Asian ethnicity had lower levels of satisfaction (70 per cent). Household type differencesPeople who live in households with children aged under 18 years had lower levels of satisfaction with their leisure time (68 per cent) than people in households without children of that age (80 per cent). Socio-economic differencesIn 2008, satisfaction with leisure time was highest for people with an annual personal income of $30,000 or less (79 per cent). This reflects the high proportion of people aged 65 years and over and 15–24 years in this income range. People with personal incomes in all income groups above $30,000 had similar levels of satisfaction with their leisure time (between 73 per cent and 70 per cent). People employed full-time had lower levels of satisfaction with their leisure time (69 per cent) than people employed part-time (80 per cent), those who were unemployed (77 per cent) or those not in the labour force (85 per cent). Regional differencesPeople who live in Porirua had the highest percentage of people satisfied with their leisure time (80 per cent), while people from Waitakere (70 per cent) and Hamilton (69 per cent) had the lowest levels of satisfaction with their leisure time. » View technical details about the satisfaction with leisure time indicator |