| Introduction | | People | | Health | | Knowledge & Skills | | Paid Work | | Economic Standard of Living | | Civil & Political Rights |
| Cultural Identity | | Leisure & Recreation | | Physical Environment | | Safety | | Social Connectedness | | Summary | | Notes & References |
DownloadPhysical Environment - PDF, 78kb |
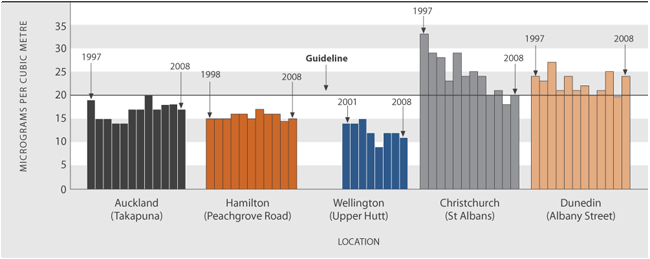
Air qualityDefinitionThe annual average PM10 levels in selected monitoring sites meet the ambient air quality guideline for PM10. PM10 is airborne particulate matter that is smaller than 10 microns in diameter. It is produced by the combustion of wood and fossil fuels (such as petrol), and from some natural sources (such as pollen). The ambient air quality guideline for PM10 is 20 micrograms per cubic metre (20μg/m3), averaged annually. RelevanceGood air quality is an important component in maintaining the health of our people, plants and animals. Clean air also contributes to the attraction of New Zealand’s natural environment to tourists and immigrants. PM10 is the primary contaminant of concern in New Zealand. Poor air quality is known to adversely affect the health of many people, particularly older people, infants, people with respiratory problems and people with chronic diseases such as heart disease.93 The health effects associated with this contaminant include increased premature mortality, the aggravation of existing respiratory and cardiovascular diseases, hospital admissions and emergency department visits, school absences, lost work days and restricted activity days. Current level and trendsFive monitoring sites, one from each of the main centres, have been selected to monitor compliance with the ambient air quality guideline for PM10. In 2008, annual average PM10 levels at four of the five selected monitoring sites met the annual air quality guideline, being at or below 20μg/m3. At the Dunedin site, PM10 levels were above the annual guideline in 2008. In 2007, all five sites met the annual guideline. Since 1997, the Dunedin and Christchurch sites have exceeded the annual average guideline in most years, although Christchurch has had improving annual results, while Dunedin’s annual results have fluctuated. Since 1997, the Auckland site has met the guideline in all years, although in 2004 the PM10 level was at the annual guideline. The annual average PM10 levels recorded at the Hamilton and Wellington sites have been consistently below the annual guideline since monitoring started at these sites, in 1998 and 2001 respectively. Figure EN1.1 Annual average PM10 levels, at selected sites, compared to the New Zealand ambient air quality guideline, 1997–2008
Source: Ministry for the Environment In September 2005, the Ministry for the Environment introduced a new air quality standard that uses a daily measure rather than the annual measure reported above. The national environmental standard for PM10 is 50 micrograms per cubic metre (50μg/m3), averaged daily over 24 hours. The standard can be exceeded on only one day per year. When sufficient time series data is available for this measure, we will expand the reporting against this standard. The standard is monitored by regional councils in "airsheds", areas within the region where air quality may, or is known to, exceed the standard or may require management in the future. To date, regional and unitary authorities have declared 68 airsheds within New Zealand. In 2008, the Christchurch airshed exceeded the average daily PM10 concentration on 18 days, the Dunedin central airshed exceeded it on nine days and the Auckland urban airshed exceeded it on six days. The Wellington and Hamilton City airsheds did not exceed the daily standard on any day in either 2007 or 2008. The number of days the Christchurch airshed exceeded the average daily PM10 concentration has improved from 27 days in 2006 and 32 days in 2005, despite increasing slightly from 14 days to 18 days between 2007 and 2008. The number of days the Dunedin airshed exceeded the daily guidelines increased from two days in 2007 to nine days in 2008, but this was similar to seven days in 2006. Auckland exceeded the daily guidelines on a similar number of days between 2005 and 2008 (between four days and seven days). In 2007, out of the 40 monitored airsheds throughout New Zealand, 42 per cent did not exceed the daily standard on more than one day a year. This was an increase from around 30 per cent in 2005 and 2006. The total number of monitored airsheds has also increased from 30 since 2005. Some smaller locations outside the main centres have difficulty meeting the air quality standards for PM10. In 2007, Alexandra/Arrowtown, Timaru, Rotorua, Nelson south, Richmond, Reefton and Kaiapoi each exceeded the daily standard on 20 days or more within the year.94 In New Zealand, poor air quality resulting from PM10 emissions is typically associated with urban areas and is a product of domestic home heating (nationally) and vehicle emissions (Auckland). Lesser sources of PM10 are industrial and agricultural emissions and natural sources of small particles that include dust, pollens and sea salt. Weather conditions and geography also influence air quality. Wind can disperse pollution, temperature inversions (where a layer of warm air stops cold air close to the ground from rising) can trap pollution and the topography of valleys can encourage air pollution to build up.International comparisonAmbient air quality is particular to one location. It is reasonable to compare particular sites between countries but not to compare countries. In 2007, the annual average levels of PM10 were similar between the five main centre New Zealand sites and the 21 sites in the Australian regions of Sydney and Port Phillip (which includes Melbourne). The New Zealand sites had annual average levels of PM10 ranging from 12–20μg/m3, while the sites in the two Australian regions had annual average PM10 levels ranging from 13–22μg/m3.95 |