| Introduction | People | Health | Knowledge & Skills | Paid Work | Economic Standard of Living | Civil & Political Rights |
| Cultural Identity | Leisure & Recreation | Safety | Social Connectedness | Life Satisfaction | Appendix | Regional Summary Sheet |
Download for Regional council areas:Regional Indicators 2010 - PDF, 2.83Mb |
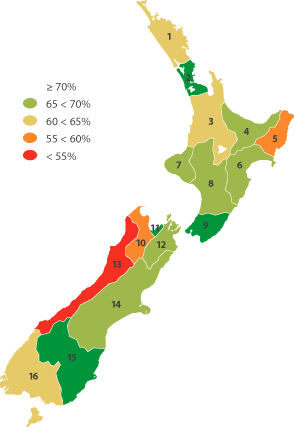
School leavers with higher qualificationsDefinition: The proportion of secondary school leavers who left school with a qualification at National Certificate of Educational Achievement (NCEA) Level 2 or above.
Percentage of school leavers with NCEA Level 2 or higher
Source: Ministry of Education |
||||||||||||||||||||||||||||||||||||||||||||||||||||||||||||||||||||||||||||||||||||||||||||||||||||||||||||