Relevance
Good air quality is an important component in maintaining our quality of life, the appeal of New Zealand as a tourist destination, and the health of people, plants and animals. PM10 is the primary contaminant of concern in New Zealand as it is known to affect many people with adverse health effects. Health effects associated with this contaminant include increased premature mortality, aggravation of existing respiratory and cardiovascular diseases, hospital admissions and emergency department visits, school absences, lost work days and restricted activity days.
Current Level And Trends
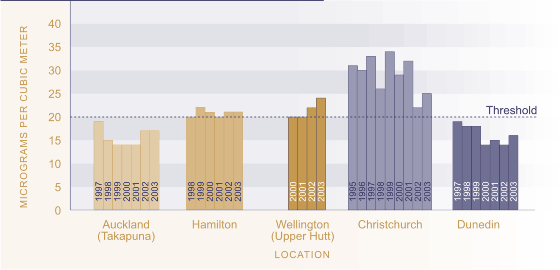
Figure EN1.1 shows that average annual PM10 levels in the air were above the ambient guideline in Christchurch for all years between 1995 and 2003. However, more recent years (2002 and 2003) may be showing evidence of an improvement. Hamilton also exceeded the guideline in 1999/2000, and in 2002/2003, but by a smaller amount.
Wellington levels appear to be on the rise with PM10 equal to the guideline in 2000/2001 and in excess of the guideline in 2002 and 2003. Levels in Auckland also appear to be on the rise, although they have not yet exceeded the annual guideline.
Dunedin consistently recorded levels of particles below the New Zealand annual guideline.
Poor air quality in New Zealand is typically associated with urban areas and is a product of vehicle emissions (Auckland) and domestic home heating (nationally). Industrial and agriculture emissions are also lesser sources of PM10, as are dust pollens and sea spray, which are natural sources of particles. Annual data presented here should not be confused with daily average PM10 concentrations, which are known to exceed health-based guidelines in 28 urban centres in New Zealand.
Figure EN1.1 PM10 concentration in
selected sites 1995-2003

Source: Ministry for the
Enviroment (2002)
Note: Data for Wellington is unavailable before 2000, for Dunedin
before 1997, and for Hamilton before 1998
International Comparison
Ambient air quality is entirely location-specific and it is not possible to compare countries. For example, it is possible to compare annual PM10 in Auckland with annual PM10 in Los Angeles, but an OECD median cannot be calculated. As a broad generalisation, however, the air quality in New Zealand's urban areas is comparable with or better than a number of OECD countries. New Zealand emits below the average OECD level for carbon dioxide on a per capita basis.74
