Obesity
Definition
The proportion of the population aged 15 and over who are obese. Obesity
is defined as having a Body Mass Index (BMI) greater than 30 for European/Other
ethnicities, or greater than 32 for Māori and Pacific peoples.28 For the population aged under 15, the measure is the
proportion of children aged 5–14 years whose BMI met internationally defined
thresholds of obesity.29
Relevance
Obesity is associated with heart disease, diabetes, stroke,
high blood pressure and some cancers. The increase in the prevalence of obesity
has been identified as a major cause of the projected increase in diabetes.30
Current level and trends
In 2003, 21 percent of adults aged 15 and over were obese, an increase from 17
percent in 1997. In 2002, 10 percent of children aged 5–14 years were obese.
The prevalence of obesity among New Zealand adults aged 15–74 years doubled between 1977 and 2003, from 9 to 20 percent
in males and from 11 to 22 percent in females.31 The major drivers of the
increase in obesity rates have been changing dietary and physical activity
patterns, reflecting an environment that promotes the over-consumption
of energy-dense foods and drinks and limits opportunities for physical
activity.32
Figure H5.1 Prevalence of obesity, total population aged 15–74 years,
by sex, 1977–2003
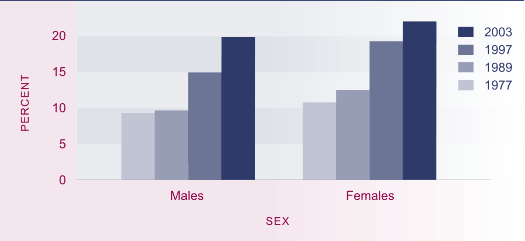
Source: Ministry of Health (2004b) Table 19, p89
Age and sex differences
Age-standardised prevalence rates for 2003
showed no significant sex difference in the proportion of adults who were
obese (males, 19 percent; females, 21 percent). Obesity increased with age
up to the 55–64
year age group (males, 29 percent; females, 31 percent), then declined in the
older age groups. This age pattern may reflect in part a cohort effect.33 Among
children aged 7–14 years in 2002, females were more likely than males to be
obese.
Table H5.1 Prevalence (%) of obesity, population aged 15 and over,
by age group and sex, 2003
| |
15–24 |
25–34 |
35–44 |
45–54 |
55–64 |
65–74 |
75+ |
Total 15+ |
| Males |
9.7 |
16.1 |
21.0 |
26.1 |
29.0 |
24.0 |
19.4 |
19.2 |
| Females |
12.4 |
20.7 |
22.0 |
24.6 |
30.9 |
27.2 |
17.1 |
21.0 |
Source: Ministry of Health (2004a) pp85–86
Ethnic differences
Obesity is more prevalent among Pacific peoples
and Māori than other ethnic groups. Among adults in 2002/2003, the age-standardised
obesity prevalence rate was 48 percent for Pacific females and 38 percent
for Pacific males. For Māori adults, the figures were 28 percent for females and 29 percent for males.
This compares with 20 percent for European/Other females and 18 percent for
European/Other males. Among children aged 5–14 in 2002, there was a similar
pattern (Pacific children: 31 percent and 26 percent for females and males
respectively; Māori children: 17 percent, 16 percent; European/Other: 6 percent, 5 percent).
Figure H5.2 Age-standardised prevalence of obesity, population aged 15 and over, by ethnic group and sex, 2002/2003
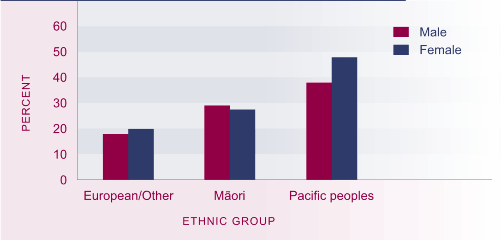
Source: Ministry of Health (2004a) Tables 13 and 14, pp103–104
Note: Rates are age-standardised using the WHO world population
Obesity levels have been increasing over time, but from 1997 to 2003 among
the Māori population there was a substantial slowing of the rate of change, compared
to the total population. The prevalence of obesity for Māori males remained steady over the period at approximately 27 percent and there
was a slight decline for Māori females, from 27.9 to 26.5 percent. Between 1997 and 2003 the obesity rate
for the total population increased for both males (from 15 to 20 percent) and
females (from 19 to 22 percent).
Socio-economic differences
The association between socio-economic status
and female obesity has been found consistently over time and using different
measures of socio-economic status. For example, in 2003, while 28 percent of
females living in quintile 5 small areas (the most disadvantaged fifth of small
areas in New Zealand ) were obese, only 16 percent of those in quintile 1 were obese. However, the
link between male obesity and socio-economic status is less well-established.34
International comparison
New Zealand has a relatively high prevalence of obesity compared with other OECD countries,
with a rate of 21 percent in 2003, compared to an OECD median of 13 percent. New Zealand ranked poorly at 22nd out of 27 countries reporting obesity prevalence in 1999–2003.
However, only three other countries base their estimates on actual measurements
and New Zealand ranked better than these: the United States (with the worst rate of obesity, at 31 percent in 2002); the United Kingdom (22 percent in 2002) and Australia (22 percent in 1999). Of all countries, Korea had the lowest prevalence of obesity (3 percent in 2001).35
|
