Participation in tertiary education
Definition
The proportion of the population aged 15 and over enrolled on 31 July
in formal tertiary education leading to a recognised New Zealand qualification. Tertiary education providers include public institutions (universities,
polytechnics, colleges of education, wānanga), and private tertiary education providers receiving government funding
or approval, or registered with the New Zealand Qualifications Authority. Qualifications
range from certificates and diplomas to bachelor and post-graduate degrees.
Relevance
The acquisition of a tertiary qualification provides individuals
with skills and knowledge that allow them to participate in society and in
the economy.
Current level and trends
In July 2004, 12 percent of the population aged 15 and
over (368,000 people) were enrolled in formal tertiary education, an increase
from 11 percent (337,000 people) in 2003. Long-term trend data is only available
for
public tertiary education institutions. In 1986, 4 percent of the population
aged 15 and over were enrolled in public tertiary education, compared to 10
percent in July 2004.
Figure K5.1 Tertiary education participation rate, 1987–2004
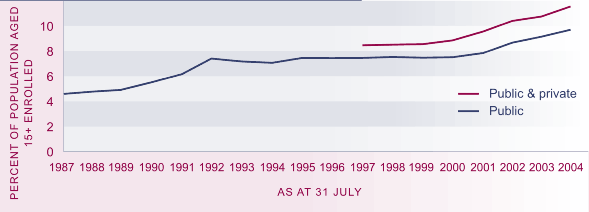
Source: Ministry of Education; Ministry of Social Development
Enrolments for courses that lead to qualifications below the level of
a bachelor’s degree have risen faster than enrolments at degree level or above
in recent years. In July 2004, 7 percent of the population aged 15 and over
were enrolled in sub-degree tertiary education courses, an increase from 3
percent in 1994. In comparison, 5 percent of the population were enrolled in
degree and post-graduate courses in 2004, a rise from 4 percent in 1994.
Age and sex differences
Tertiary education participation is highest among 18–24
year olds. Recent increases in tertiary participation rates have been greatest
at ages 25 and over, while the participation rate for those under 18 years
has fluctuated.
Women are increasingly more likely than men to participate in tertiary
study at ages 18 and over. The difference is greatest in the high-incidence
age group of 18–24 year olds, where the difference in male and female rates
of participation increased from one to eight percentage points between 1994
and 2004. There is little difference between males and females in the level
of tertiary study at which they are enrolled. Of all tertiary students enrolled
in mid-2004, 35 percent of students of both sexes were enrolled in degree courses
and 8 percent were enrolled in post-graduate courses.
Table K5.1 Tertiary participation rates (%), by age and sex, selected
years, 1994–2004
| Sex, year |
15–17 years |
18–24 years |
25–39 years |
40+ years |
Total |
| Males |
|
|
|
|
|
| 1994 |
4.4 |
25.7 |
6.5 |
1.6 |
6.8 |
| 1996 |
4.7 |
26.3 |
7.0 |
1.7 |
7.0 |
| 2001 |
9.0 |
32.7 |
9.1 |
2.4 |
8.5 |
| 2004 |
9.0 |
34.5 |
11.0 |
3.5 |
9.9 |
| Females |
|
|
|
|
|
| 1994 |
3.6 |
26.6 |
7.2 |
2.4 |
7.3 |
| 1996 |
4.6 |
28.4 |
8.3 |
2.7 |
7.9 |
| 2001 |
8.5 |
37.3 |
12.4 |
4.0 |
10.6 |
| 2004 |
8.3 |
42.4 |
16.0 |
5.9 |
13.1 |
Source: Ministry of Education; Ministry of Social Development
Note: From 1997 includes participation in both public and private tertiary
education institutions
Ethnic differences
Māori participation
in tertiary education has increased sharply in recent years. In July 2004,
the age-standardised tertiary education participation rate for Māori was 16 percent, almost double the rate in 1999 (9 percent). In comparison,
non-Māori participation increased from 9 percent in 1999 to 11 percent in 2004. The
age-standardised rate has been higher for Māori than for non-Māori since 2001.45
Māori participation in tertiary education is higher than non-Māori
participation among those under 18 and over 25, but considerably lower than
non-Māori participation at the core tertiary education ages of 18–24 years. However,
participation in this age group has been growing. In 2004, 27 percent of Māori aged 18–24 were enrolled in tertiary education, compared with 20 percent
in 1999. The non-Māori participation rate at 18–24 years was 35 percent in 1999 and 41 percent in
2004.
Table K5.2 Tertiary participation rates (%), by age and sex, Māori
and non-Māori, 2004
| Age group |
Māori % |
Non-Māori % |
| Male |
Female |
Total |
Male |
Female |
Total |
| 15–17 |
12.0 |
13.3 |
12.6 |
8.2 |
6.9 |
7.5 |
| 18–24 |
20.0 |
34.5 |
27.3 |
37.5 |
44.1 |
40.7 |
| 25–39 |
13.0 |
26.0 |
19.8 |
10.6 |
14.1 |
12.4 |
| 40+ |
8.0 |
16.0 |
12.2 |
3.0 |
4.9 |
4.0 |
| Total |
12.3 |
22.3 |
17.5 |
9.6 |
11.8 |
10.7 |
Source: Ministry of Education; Ministry of Social Development
There are marked ethnic differences in the level at which tertiary students
are enrolled, with Māori and Pacific students being less likely to be enrolled in degree-level courses
than students from European, Asian or "Other" ethnic groups.
International comparison
There are currently no robust measures of tertiary participation
across OECD countries. Some indication of New Zealand's relative standing can be gained from the proportion of the population enrolled
in education at various ages. Taking the 20–29 year age group, who are
more likely to be enrolled in tertiary than secondary education, in 2002,
New Zealand ranked 12th out of 27 countries with a rate of 25 percent –
the same as the OECD median. The New Zealand rate was about the same as that of the United States but below the rates for Australia (33 percent) and the United Kingdom (27 percent).46
|
