Market income per person
Definition
The total value of goods and services available to New Zealanders, expressed in inflation-adjusted dollars, per head of population, also known as real gross national disposable income (RGNDI) per person.
Relevance
Per capita RGNDI measures the average income available to New Zealanders. A nation with a rising per capita RGNDI will have a greater capacity to deliver a better quality of life and standard of living to the population.
Current level and trends
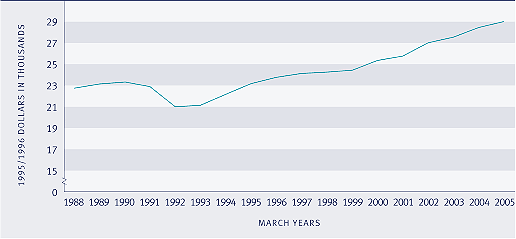
In the year to March 2005, RGNDI per person was $28,998 in constant 1995/1996 dollars compared with $22,735 in 1988. The average annual growth rate between 1988 and 2005 was 1.4 percent. RGNDI grew slowly between 1988 and 1990 and fell sharply between 1990 and 1992. Since 1992, there has been uninterrupted though variable growth, reflecting labour productivity gains, increasing labour force participation and declining unemployment.
Figure EC1.1 Real gross national disposable income per capita, 1988–2005

Source: Statistics New Zealand
International comparison
Comparisons with other OECD countries are available for a related measure: gross domestic product (GDP) per person compared by using purchasing power parities (PPP). By this measure, New Zealand was ranked 21st out of 30 OECD countries in 2004, the same ranking as in the previous four years. By way of comparison, New Zealand was the 18th most prosperous out of 26 countries in 1986, and the ninth most prosperous in 1970. Between 1986 and 2004, real GDP per person, using US dollars and PPPs for the year 2000, grew by 27 percent in New Zealand compared with an OECD average of 41 percent.
Economic value of unpaid work
RGNDI does not take into account the value of unpaid work such as looking after one’s own children, cooking meals at home, fixing the car, doing home maintenance, or doing voluntary work in the community. Using data from the 1998/1999 Time Use Survey, the value of unpaid work in 1999 was estimated to be $39,637 million (1998/1999 dollars), equivalent to 39 percent of GDP, or $10,333 per capita.54
|

