Population with low living standards
Definition
The proportion of the population with a standard of living characterised by "severe hardship", "significant hardship" and "some hardship": Levels 1–3 of the Economic Living Standard Index (ELSI), as measured in the New Zealand Living Standards Surveys.
Relevance
ELSI is an indicator of how people are living in terms of their possessions and activities and how they get by financially. Having a low living standard limits a person’s ability to participate in the wider society, curtails their quality of life, and can have negative long-term consequences across a wide range of social and economic outcomes.
Current level and trends
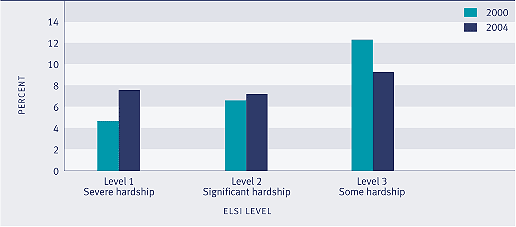
In 2004, around one-quarter of the population (24 percent) had living standards in the bottom three levels of the ELSI scale. This was the same proportion as in 2000. However, within the three levels, there was a movement towards the lower level over the period. Between 2000 and 2004, there was an increase of 3 percentage points in the proportion of the population experiencing severe hardship and a drop of 3 percentage points in the proportion experiencing some hardship. The proportion experiencing significant hardship did not change between 2000 and 2004.
The ELSI measure is a relatively new tool and there is still more to be understood about some of its properties. It is not a final product and ongoing scrutiny and analysis are expected to lead to improvements.
Figure EC4.1 Proportion of the population with low living standards, 2000 and 2004

Sources: Ministry of Social Development (2003b); Ministry of Social Development (2006)
Population group differences
In 2004, some population groups were more likely than others to experience low living standards, including dependent children and families with dependent children (particularly those with three or more children), sole-parent families, Pacific families, beneficiaries and those living in Housing New Zealand rented dwellings.
The probability of having low living standards declines with age, except for a slight increase during peak child-rearing years.
Table EC4.1 Proportion of population and economic families with low living standards (ELSI Levels 1–3), 2000 and 2004
| |
Percent |
| |
2000 |
2004 |
| Total population |
24 |
24 |
| Males |
23 |
23 |
| Females |
24 |
25 |
| Dependent children (under 18 years) |
36 |
38 |
| 18–24 years |
19 |
22 |
| 25–44 years |
25 |
24 |
| 45–64 years |
18 |
17 |
| 65 years and over |
7 |
8 |
| |
|
|
| Total economic families |
20 |
21 |
| By number of children and family type |
|
|
| With one dependent child |
31 |
32 |
| With two dependent children |
31 |
30 |
| With three or more dependent children |
42 |
43 |
| Sole-parent families |
55 |
60 |
| Two-parent families |
25 |
23 |
| By ethnic group |
|
|
| With any Māori members |
34 |
33 |
| With any Pacific members |
49 |
54 |
| With any European members |
16 |
17 |
| With any Other ethnic group members |
25 |
22 |
| By main source of income |
|
|
| New Zealand Superannuation |
7 |
8 |
| Income-tested benefits |
47 |
51 |
| Market income |
16 |
17 |
| By housing tenure |
|
|
| Rented – Housing New Zealand |
61 |
61 |
| Rented – Private |
31 |
34 |
| Owned with mortgage |
19 |
16 |
| Owned without mortgage |
8 |
7 |
Sources: Ministry of Social Development (2003b); Ministry of Social Development (2006)
Notes: (1) The New Zealand Living Standards 2000 data has been re-weighted and differs from previously published data
(2) None of the changes between 2000 and 2004 reported in the table above are statistically significant
|

