Population with low incomes
Definition
The proportion of the population in households with equivalent disposable income net-of-housing-cost below two thresholds.
Incomes are after-tax (disposable) and after deducting housing costs, and the incomes are adjusted for household size and composition. The thresholds are set at 50 percent and 60 percent of the 1998 household disposable income median, with 25 percent deducted to allow for average housing costs. The thresholds are adjusted for inflation to keep them fixed in real terms.
Relevance
Insufficient economic resources limit people’s capability to participate in and belong to their community and wider society and otherwise restrict their quality of life. Furthermore, long-lasting low family income in childhood is associated with negative outcomes, such as lower educational attainment and poorer health.
Current level and trends
In the year to June 2004, 17 percent of the population was living below the 60 percent threshold, down from 19 percent in the previous survey year to June 2001. The proportion of the population with low incomes rose sharply from 1990, reached a peak in the mid-1990s and has been declining generally since then. However, in 2004, the proportion was still substantially above what it had been in the 1980s.
The increase in the proportion of the population with low incomes through the early 1990s is attributable to declining household incomes arising from high rates of unemployment and reduced levels of social assistance. The improvement in this measure since the mid-1990s reflects more robust economic (and income) growth, the steady decline in unemployment and the increase in housing assistance for those at the low end of the income distribution. Rates remain higher in 2004 than in the 1980s in part because housing costs for low-income households rose significantly as a proportion of their household incomes over that period.
Figure EC3.1 Proportion of population with net-of-housing-cost household incomes below thresholds, 1982–1998, 2001 and 2004
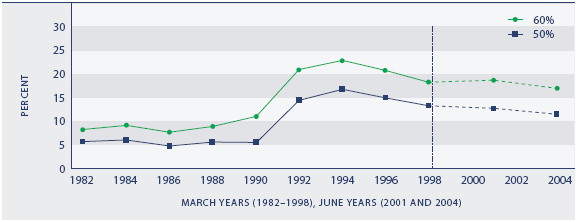
Source: Derived from Statistics New Zealand's Household Economic Survey (1982–2004), by the Ministry of Social Development
Population group differences
In 2001 and 2004, there is a clear decrease across age groups in the proportion below the 60 percent threshold. The relatively low rates for older New Zealanders reflect the high rate of mortgage-free home ownership for this group. The relative position of the 18–24 years age group deteriorated in the first half of the 1990s and had not recovered by 2004.
In 2004, 23 percent of dependent children were in households with incomes below the 60 percent line, a decline from 29 percent in 2001. The 2004 rate was substantially below the peak of 35 percent in 1994, but was still above the levels of the mid-1980s (11 percent).
Rates for females aged 15 years and over have been a little higher than for males, although the gap closed in 2004.
Table EC3.1 Proportions (%) in low-income households (60 percent threshold), by age and sex, selected years, 1986–2004
| Year |
Children |
18–24 |
25–44 |
45–64 |
65+ |
Males 15 + |
Females 15+ |
Total |
| 1986 |
11 |
5 |
8 |
5 |
4 |
5 |
7 |
8 |
| 1990 |
16 |
8 |
12 |
6 |
6 |
8 |
9 |
11 |
| 1994 |
35 |
20 |
23 |
15 |
8 |
17 |
20 |
23 |
| 1998 |
28 |
16 |
18 |
12 |
9 |
13 |
16 |
18 |
| 2001 |
29 |
21 |
18 |
14 |
7 |
14 |
17 |
19 |
| 2004 |
23 |
22 |
17 |
13 |
7 |
15 |
15 |
17 |
Source: Derived from Statistics New Zealand's Household Economic Survey (1986–2004), by the Ministry of Social Development
Ethnic differences
Proportions below the 60 percent threshold fell from 1994 to 2004 for all ethnic groups (Māori, Pacific peoples, European and Other), with Māori recording the largest proportional fall of close to 50 percent. In 2004, those of Pacific and Other ethnicity had the highest proportions under the threshold (29 percent and 38 percent respectively), and Europeans the lowest (12 percent). Māori rates fell between the two (22 percent).
Figure EC3.2 Proportion of the population with net-of-housing-cost household incomes below the 60 percent threshold, by ethnic group, 1982–1998, 2001 and 2004
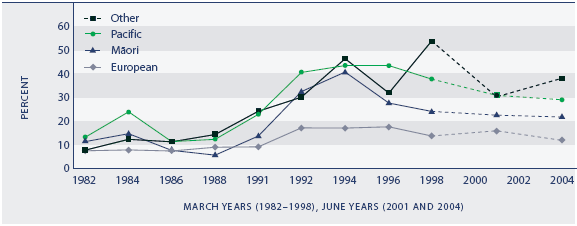
Source: Derived from Statistics New Zealand's Household Economic Survey (1982–2004), by the Ministry of Social Development
Household and family type differences
Since the mid-1990s, the proportion of people in sole-parent families below the 60 percent threshold has been two to three times that of those in two-parent families (42 percent and 16 percent respectively in 2004). Households with three or more children have a higher proportion under the 60 percent threshold than those with only one or two children (28 percent and 16 percent respectively in 2004). There has been a substantial rise in the proportion of those under 65 years in one-person households who are below the threshold. The rate rose to 30 percent in the early 1990s and it remained relatively high (27 percent) in 2004.
International comparison
Based on the measure used by the OECD – 50 percent of median equivalent disposable household income and not taking housing costs into account – 9.8 percent of New Zealanders in 2000 were living in households with incomes below the low-income threshold.57 This figure places New Zealand in the middle of the OECD ranking, with a rate similar to Canada (10.3 percent), slightly below Australia (11.2 percent) and the United Kingdom (11.4 percent), and well below the United States (17.0 percent). Denmark has the lowest proportion with low incomes (4.3 percent). By 2004, the New Zealand rate was 10.8 percent.
|
