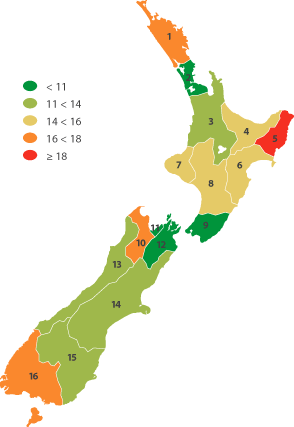
Suicide
Definition: The number of suicides per 100,000 population.

Suicide deaths per 100,000 population, 2003-2007
| Region |
Male |
Female |
Total |
| 1 |
Northland |
27.1 |
7.8 |
17.1 |
| 2 |
Auckland |
15.3 |
5.3 |
10.1 |
| 3 |
Waikato |
19.1 |
4.5 |
11.5 |
| 4 |
Bay of Plenty |
24.9 |
5.2 |
14.6 |
| 5 |
Gisborne |
32.6 |
5.2 |
18.5 |
| 6 |
Hawke’s Bay |
23.2 |
7.8 |
15.2 |
| 7 |
Taranaki |
23.0 |
6.1 |
14.4 |
| 8 |
Manawatu-Whanganui |
24.0 |
6.3 |
15.0 |
| 9 |
Wellington |
14.5 |
5.6 |
9.9 |
| 10 |
Tasman |
23.0 |
10.8 |
16.6 |
| 11 |
Nelson |
14.5 |
4.7 |
9.5 |
| 12 |
Marlborough |
15.3 |
4.7 |
9.9 |
| 13 |
West Coast |
22.9 |
4.8 |
13.8 |
| 14 |
Canterbury |
17.2 |
6.8 |
11.9 |
| 15 |
Otago |
15.3 |
7.1 |
11.1 |
| 16 |
Southland |
29.4 |
4.5 |
17.0 |
| New Zealand |
18.3 |
5.8 |
11.9 |
Source: Ministry of Health
Note: Age-standardised to WHO standard population.
Hospitalisation for intentional self-harm
Hospitalisations for intentional self-harm per 100,000 population, 2003-2007
| Region |
Male |
Female |
Total |
| 1 |
Northland |
63.9 |
117.6 |
91.0 |
| 2 |
Auckland |
37.2 |
54.8 |
45.9 |
| 3 |
Waikato |
55.1 |
106.7 |
81.1 |
| 4 |
Bay of Plenty |
57.6 |
102.0 |
80.0 |
| 5 |
Gisborne |
53.3 |
105.2 |
79.6 |
| 6 |
Hawke’s Bay |
44.9 |
90.1 |
67.9 |
| 7 |
Taranaki |
71.3 |
116.9 |
94.2 |
| 8 |
Manawatu-Whanganui |
60.1 |
103.5 |
82.0 |
| 9 |
Wellington |
48.6 |
108.3 |
79.0 |
| 10 |
Tasman |
46.1 |
136.6 |
90.9 |
| 11 |
Nelson |
76.2 |
217.4 |
146.6 |
| 12 |
Marlborough |
90.0 |
152.9 |
120.2 |
| 13 |
West Coast |
58.9 |
160.7 |
108.8 |
| 14 |
Canterbury |
56.3 |
125.2 |
90.7 |
| 15 |
Otago |
50.4 |
102.5 |
76.7 |
| 16 |
Southland |
54.3 |
105.3 |
79.2 |
| New Zealand |
49.3 |
92.7 |
71.2 |
Source: Ministry of Health
Note: Age-standardised to WHO standard population. |