Relevance
The degree of income inequality is often regarded as an important aspect of the fairness of the society we live in. A high level of income inequality may also be detrimental to the level of social connectedness across society.
Current Level And Trends
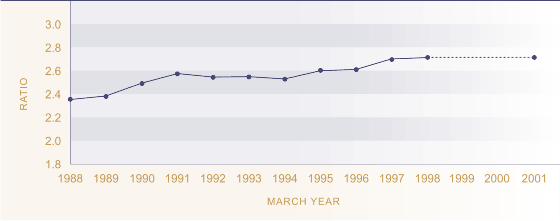
In 2001, the disposable income of a household at the 80th percentile was 2.7 times larger than the income of a household at the 20th percentile. In 1988, the ratio was 2.4. Income inequality rose between 1988 and 1991, then fell slightly, and has been rising since 1994. The rapid rise occurring between 1988 and 1991 was largely due to widespread economic reforms, combined with major changes to the social welfare system. The economic recession and large rise in unemployment exacerbated inequalities.
Most of the observed increase in inequality has been due to a relatively larger overall rise in the incomes of the top 20 percent of income earners, particularly between 1988 and 1990 and between 1994 and 1998. Incomes of those in the bottom 20 percent have remained approximately constant after adjusting for inflation over the whole period. The middle 60 percent experienced some slight decline between 1988 and 1994 followed by increases between 1994 and 1998.
Figure EC2.1 Ratio of the 80th
percentile of disposable household income to the 20th percentile of
disposable household income, 1988-1998, 2001

Source: Derived from Statistics
New Zealand's Household Economic Survey by the Ministry of Social
Development
Note:
1. This measure does not adjust for household size
2. The weightings of the records in the sample have been revised for
all years since The Social Report 2001
International Comparison
Comparisons with other OECD countries are available using a different measure, the Gini co-efficient.51 During the mid-1990s, New Zealand performed worse than the OECD median and ranked 15th out of 21 countries. The best performers were the Scandinavian countries. Australia, the United Kingdom, the United States and Canada, along with New Zealand, were in the bottom half of the OECD for income inequality.52
