Economic standard of living
OUTCOMES
Everyone has access to an adequate income and enjoys a standard of living that means they can participate fully in society and have choice about how to live their lives.
INTRODUCTION
Economic standard of living concerns the physical circumstances in which people live, the goods and services they are able to consume, and the economic resources they can access to exercise choice about how they live their lives.
This chapter presents a number of different indicators, each of which provides information on a different aspect of economic standard of living. The indicators chosen include income-based measures of economic standard of living, direct measures of the material circumstances in which people live, and a subjective measure of how people rate their own economic standard of living.
The first indicator, Real Gross National Disposable Income (RGNDI) per capita, provides an indication of the average level of market income available to New Zealanders. This allows us to examine trends over time in the income New Zealanders have access to, and to make comparisons between New Zealand and other countries. This is followed by a measure of income inequality to provide an indication of trends in how that income is distributed across households.
The remaining five indicators concern the proportion of the population with low incomes, those with high housing costs compared to their incomes, those who experience household crowding, those who report that sometimes their household cannot afford to eat properly and those who regard their own household's standard of living as either "low" or "fairly low". Internationally, different countries take different approaches to measuring low levels of economic standard of living, ranging from official poverty lines to survey-derived direct measures of living standards through to having no official measure at all. New Zealand currently has no official poverty measure. However, a number of different unofficial measures of poverty or economic hardship exist that can provide insights into different aspects of economic standard of living. These include the Poverty Measurement Project's poverty lines which divide the New Zealand population into the poor and non-poor, and NZDep 962 which ranks geographical areas in terms of relative deprivation.
It is not the purpose of this report to set a specific poverty line. Instead it reports on three different measures for the low incomes indicator, based on an approach used internationally. Nor does the report seek to provide a single scale for assessing economic standard of living - a number of indicators are used to illuminate different aspects of living standards.
KEY POINTS
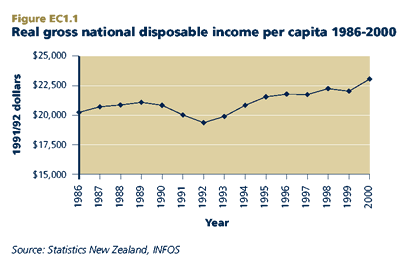
- Market income per person grew slowly from 1986 to 1989, then declined until 1992 before rising again since then.
- Income inequality has increased over the past decade. Much of the increased gap between high and low income earned is due to a larger overall rise in the incomes of high income earners than for other groups.
- Data on low incomes shows an increase in the proportion of the population experiencing low incomes between 1988 and 1994. Between 1994 and 1998 (the most recently available data), the proportion of the population with low incomes has decreased, but remains well above 1988 levels. The incidence of low incomes is particularly high for sole parent families, those reliant on benefit income, those living in rented accommodation and for Pacific peoples, Māori and the "Other" ethnic group.
- One quarter of households pay housing costs greater than 30 per cent of their income - a proportion that has been rising over the decade from 1988 to 1998.
- Household crowding affects 3.4 per cent of the population, including 5.3 per cent of all children. Māori and Pacific people have a much higher probability of living in a crowded household than other ethnic groups.
- Self-reported food insecurity affected 13 per cent of New Zealand households in 1997. Māori and Pacific peoples were more likely than other ethnic groups to report that their household could only sometimes afford to eat properly.
- Self-reported low standard of living largely reflects trends in the direct indicators of economic standard of living with 8.1 per cent of the population regarding their household's standard of living as "low" or "fairly low". Sole parent families had a considerably higher probability of reporting low living standards than the rest of the population.
SUMMARY
New Zealand's per capita market income has increased since 1988. However, this increase has not been reflected in the economic standard of living of all New Zealanders. Income inequality increased over the decade from 1988 to 1998. Those at the top end of the income distribution have improved their position, while the incomes of those at the bottom or in the middle of the distribution have remained constant or decreased in real terms.
The impact of low incomes on the economic standard of living of the population is reflected in the direct measures of living standards. These show that a relatively small but significant part of the population is likely to experience crowding or food insecurity.
Sole parent families, Māori, Pacific and other non-European/Pākehā families are more likely than other groups to have a low economic standard of living. Both direct and subjective measures of economic standard of living suggest that low living standards are concentrated among working age families rather than the retired population.
While the indicators presented in this report show a fairly coherent picture of economic standard of living, they also highlight gaps in our current knowledge. This is especially the case for information on the relationship between low incomes, direct measures of hardship, and subjective measures of living standards. More robust direct measures of hardship need to be collected over time to provide a time series picture of living standards to complement our income-based time series. Better information is also needed on the dynamics of hardship, to understand the extent to which it is the same people and families who are most affected over longer periods of time.
Market income per person
DEFINITION
Real Gross National Disposable Income (RGNDI) is a measure of the total volume of goods and services available to New Zealanders. Because it is a measure of volume it is not affected by inflation. This indicator is RGNDI per person.
RELEVANCE
Per capita national disposable income gives a measure of the average income available to New Zealanders. A nation with rising per capita RGNDI will have greater capacity to deliver a better quality of life and standard of living to the population.
CURRENT LEVEL AND TRENDS
In 2000, RGNDI per person was $23,086 in constant 1991/92 dollars compared with $20,097 in 1986 (1991/92 dollars). This represents an average growth rate over the period of just under 1.0 per cent per year. RGNDI grew slowly between 1986 and 1989, before falling to below its 1986 level by 1992. Since 1992, there has been steady growth, except for 1998-99.
INTERNATIONAL COMPARISONS
Comparisons with other OECD countries are available for the slightly different measure, real gross domestic product (GDP) per person. Using real GDP per person in constant (1995) US dollars, adjusted for purchasing power parity, New Zealand ranked 20th out of 26 OECD countries in 1999 compared with 18th in 1986 and 9th in 1970. Between 1986 and 1999, real GDP per person in New Zealand grew by 9.5 per cent compared with an OECD average of 29 per cent.
Income inequality
DEFINITION
Income inequality refers to the extent of disparity between high and low incomes. The measure used here is the ratio of the 80th percentile to the 20th percentile of the household disposable income distribution (that is, the ratio of a high household income to a low household income). The higher this ratio, the greater the level of inequality.
RELEVANCE
The degree of income inequality and changes in inequality are widely regarded as an important aspect of the type of society we live in. While views about whether an increase in inequality is of concern will depend in part on the initial level of inequality, there has been widespread concern in New Zealand about the extent of the increase in inequality since the mid-1980s.
CURRENT LEVEL AND TRENDS
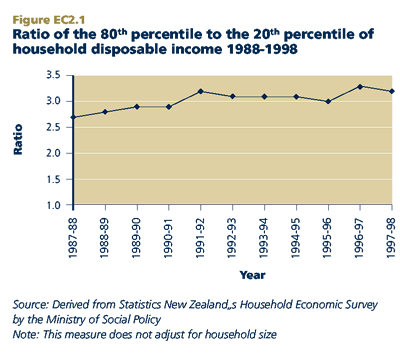
The graph below shows that, in 1998, the disposable income of a household at the 80th percentile was 3.2 times larger than the income of a household at the 20th percentile of incomes. In 1988, the ratio was 2.7.
Income inequality rose between 1987/88 and 1991/92; it then fell slightly up to 1995/96 before increasing again the following year. Most of the observed increase in inequality has been due to a relatively larger overall rise in the incomes of the top 20 per cent of income earners, particularly between 1988 and 1990 and between 1994 and 1998. Incomes of those in the bottom 20 per cent have remained approximately constant after adjusting for inflation over the whole period. The middle 60 per cent experienced some slight decline between 1988 and 1994 followed by increases between 1994 and 1998.
Population with low incomes
DEFINITION
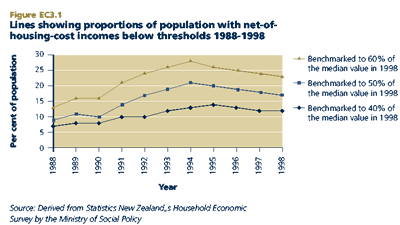
The proportion of the population in economic family units with equivalent income net of housing costs below three thresholds (specified as 40 per cent, 50 per cent and 60 per cent of the median of the 1998 equivalent net-of-housing-cost incomes). The measures take account of incomes, housing costs and family size and are adjusted for inflation and taxes. The lines are specified in terms of constantvalue thresholds (i.e. based on the 1998 median, rather than moving-value thresholds that change over time).
RELEVANCE
Insufficient economic resources limit individuals' ability to participate in their community and wider society and otherwise restrict their quality of life. Furthermore, a consistent finding across the literature on outcomes for children is that low family income in childhood, if it is long-lasting, is associated with a higher likelihood of negative outcomes, such as lower educational attainment.
CURRENT LEVEL AND TRENDS
Over the 1988 to 1994 period, the proportion of the population below the 60 per cent threshold increased from 13 per cent to 28 per cent. Since 1994, this proportion has declined to 23 per cent. The 40 per cent and 50 per cent lines follow a similar trend increasing between 1988 and 1994 (and 1995 in the case of the 40 per cent threshold) and subsequently declining or leveling out towards the end of the decade. The proportion of the population below these thresholds was, however, substantially higher in 1998 than in 1988.
POPULATION GROUP DIFFERENCES
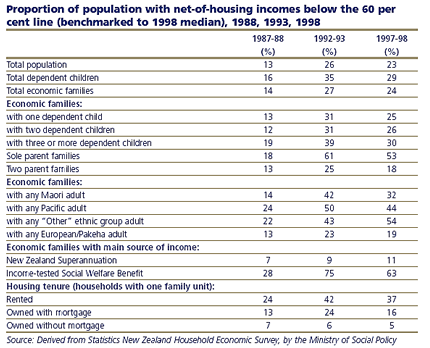
In 1988, 16 per cent of all dependent children were in economic family units below the 60 per cent line (benchmarked to the 1998 median). This grew to 35 per cent by 1993, and has subsequently declined to 29 per cent in 1998. Higher than average likelihoods of being below the 60 per cent line exist for sole parent families, families reliant on income-tested benefits as their main source of income, families with any Māori adult, Pacific adult, or adults belonging to the "Other" ethnic group, those living in rented dwellings, and economic families with dependent children (in particular, large families). Many of these groups also recorded an above-average growth in the likelihood of being below the line as the decade advanced. By 1998, however, the proportion of all these groups below the 60 per cent benchmark line had declined, although not back to 1988 levels. The exception to this was the "Other" ethnic group for whom the proportion has continued to rise.
INTERNATIONAL COMPARISONS
Based on a measure of 60 per cent of median equivalent disposable household income in 1998, New Zealand ranked 12th out of 20 OECD countries. (This comparative measure is not net-of-housing costs.) This was behind the majority of European countries and Canada, on a par with Australia, and with a lower proportion of low (relative) income households than the United Kingdom and the United States.
Housing affordability
DEFINITION
The proportion of households spending more than 30 per cent of their income on housing.
RELEVANCE
Affordable housing is an important factor in the well-being of individuals and families. High housing costs relative to income are often associated with severe financial difficulty, especially among low income households, and can leave such households with insufficient income to meet other basic needs such as food, clothing, transport, medical care and education.
CURRENT LEVEL AND TRENDS
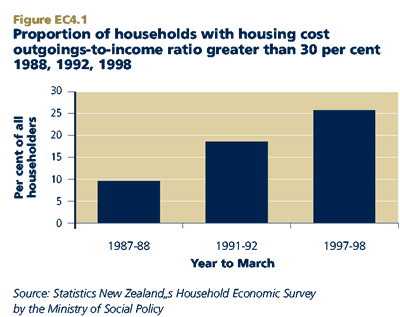
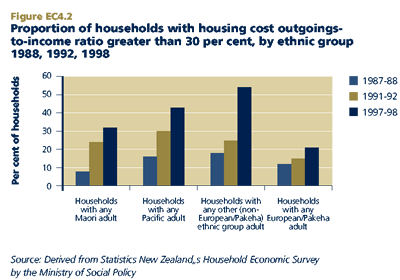
In 1998, 25 per cent of households spent more than 30 per cent of their income on housing costs. Since the late 1980s, there has been a substantial increase in the proportion of households spending more than 30 per cent of their income on housing. Between 1988 and 1992 the proportion rose from 12 per cent to 17 per cent of households. The proportion grew further between 1992 and 1998 to 25 per cent.
High housing costs relative to household income are of greatest concern in respect of low income households. Analysis of data on those households in the lowest 20 per cent of the (equivalised) household income distribution shows a similar increasing trend over the 1988-1998 period but with significantly higher proportions of households spending more than 30 per cent of income on housing. In 1998, 43 per cent of households in the lowest fifth of the household income distribution spent more than 30 per cent of their income on housing. This has increased from 16 per cent in 1987/88.
It is important to remember that this indicator will include some people whose high housing outgoings or low incomes represent only a temporary state of affairs, as, for example, they choose to make high mortgage repayments, or are temporarily out of work or in full-time study.
Household crowding
DEFINITION
The proportion of the population living in crowded housing (i.e. requiring two or more additional bedrooms, as defined by the Canadian Housing Index).
RELEVANCE
Housing space adequate to the needs and desires of a family is a core component of quality of life. The Canadian crowding index is a proxy measure to monitor the incidence of household "crowding" in the population. Although the relationship is not always clear, national and international studies indicate an association between the prevalence of certain infectious diseases and household crowding as well as between crowding and poor educational attainment. Crowding can also contribute to psychological stress for people in the households concerned.
CURRENT LEVEL (NO TREND DATA AVAILABLE)
In 1996, 115,300 people, or 3.4 per cent of the New Zealand resident population, lived in households requiring two or more additional bedrooms.
ETHNIC DIFFERENCES
Māori and Pacific people are over-represented among those living in households requiring two or more additional bedrooms. In 1996, 8.8 per cent of Māori and 17.9 per cent of Pacific peoples lived in houses meeting the definition of crowding used here. Of all people living in crowded households, 74.6 per cent identified as belonging to the Māori or Pacific ethnic groups.
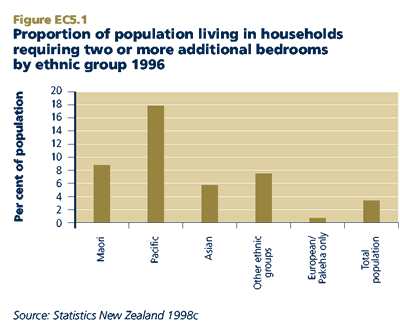
Among Asian ethnic groups, the Cambodian and Vietnamese groups had the highest proportion of people living in households requiring two or more additional bedrooms (21.8 per cent and 21.6 per cent respectively). Of the Asian group experiencing crowding, 85.5 per cent were born overseas, compared with 78.6 per cent of all people of Asian ethnicity. Crowding levels for all migrants tended to reduce the longer they had lived in New Zealand.
REGIONAL DIFFERENCES
There is considerable regional variation in the proportion of households that meet the above definition of crowding (regional data on the proportion of individuals living in crowded housing is not available). Overcrowding is more common in urban areas, with the highest proportions of crowded homes in Southern Auckland (4.5 per cent of homes in 1996), Porirua (3.2 per cent) and Central Auckland (2.6 per cent). In terms of the 16 regions, Gisborne had the highest proportion of crowded homes (2.5 per cent), followed by Auckland (2.4 per cent). The lowest proportions of crowded housing were in the Otago and Southland regions (both 0.4 per cent of homes).
OTHER DIFFERENCES
Nearly all (90 per cent) crowded households contained children and nearly 60 per cent included young children under five years. In 1996, just over 50,000 children under 18 were living in households which required two or more additional bedrooms. This figure represents 5.3 per cent of all children in New Zealand. Households requiring two or more additional bedrooms were more likely to be rented than owned. The proportion of these households paying rent (51.4 per cent) was more than twice the national average of 24.6 per cent. Unemployment rates were two to four times higher than average for people living in crowded houses. Income levels of people in these houses are also lower on average. More than half of adults in these homes had received income support (other than New Zealand Superannuation) in the 12 months prior to the 1996 Census, compared with one in five adults in the population as a whole.
Food insecurity
DEFINITION
The proportion of the population who report that their household can afford to eat properly only sometimes.
RELEVANCE
According to the World Food Summit, food security exists when all people, at all times, have physical and economic access to sufficient, safe and nutritious food to meet their dietary needs and food preferences for an active, healthy life. While the experience of "hunger" is relatively uncommon in most developed nations, some groups of people at some stages of their life can experience "food insecurity". Food insecurity can be used as a direct measure of material hardship.
CURRENT LEVEL (NO TREND DATA AVAILABLE)
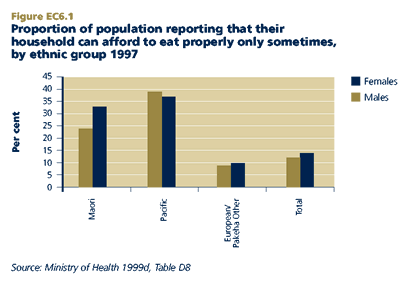
In 1997, 13 per cent of New Zealanders reported that their household could afford to eat properly only sometimes. More Māori and Pacific peoples reported that their households can afford to eat properly only sometimes compared with those from the European/Pakeha and "Other" ethnic groups. The figures for gender given in Figure 6.1 need to be treated with caution, as the gender information is that of the person responding to the nutrition survey, whereas the information relates to the household.
Self-reported standard of living
DEFINITION
The proportion of people rating their standard of living as "low" or "fairly low". The other response categories were "medium", "fairly high" or "high".
RELEVANCE
The proportion of the population with a self-reported low standard of living is a subjective measure of living standards. A subjective measure of economic standard of living gives information on how people feel about their own standard of living, and provides a useful context for the indirect and direct measures reported in this chapter.
CURRENT LEVEL (NO TREND DATA AVAILABLE)
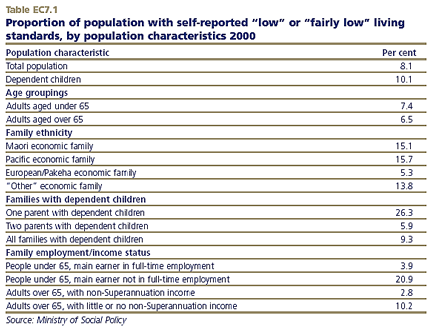
The survey of living standards shows that eight per cent of the total population have a "low" or "fairly low" self-rated living standard (as assessed by the adult answering the survey).
POPULATION DIFFERENCES
Over 10 per cent of dependent children are living in households where the adult answering the survey regards living standards as "low" or "fairly low". Sole parent families in particular are likely to have low self-rated standard of living, with more than 26 per cent reporting a "low" or "fairly low" standard of living. Higher proportions of those under 65 years than those over 65 years have "low" or "fairly low" self-rated living standards. The likelihood of having low living standards is also higher among economic family units with any Māori, Pacific or "Other" ethnic group member. Fourteen to 16 per cent of these economic families have a low self-rated living standard, compared with eight per cent of the total population.
