The Environment
OUTCOMES
A clean and healthy environment is maintained, sustaining nature and meeting the needs of people now and in the future.
INTRODUCTION
The natural environment may be defined as those bio-physical aspects of the world that are shared in common and that contribute to well-being and quality of life. These shared aspects include the air we breathe, the water we drink, and the various species of plant and animal life that support human existence by providing both "ecosystem services" and the resources that provide food, shelter, clothing, and opportunities for social and economic development.
It is possible to achieve impressive economic growth in the short term at the expense of our long-term well-being if the consequences of that economic growth on our natural environment are ignored. As a result, the concept of sustainable development has become important when talking about quality of life and well-being.
While there is still much debate on how to define sustainable development, common elements are that natural non-renewable resources are finite, that there are limits to the carrying capacity of the earth's ecosystems, that economic, environmental and social goals must be pursued within these limits, and that there is a need for inter- and intragenerational equity. Intergenerational equity entails leaving future generations an ecologically viable planet with abundant resources, while intragenerational equity entails distributing the environmental costs and benefits fairly among people living now. Evidence from OECD countries shows that a shift to less environmentally damaging consumption patterns is possible without reductions in the quality of life.
Despite controversy over the term, there is widespread agreement that sustainable development is important and that indicators to measure progress towards it are needed. Because changes in environmental conditions are often invisible, occur over long time periods, and are complex, indicators help make the state and direction of our physical environment visible. This helps people to make informed decisions about their own well-being and the quality of life they wish to pass on to future generations. The indicators selected for this report provide measures of air and water quality. Clean air and good drinking water are not only necessities but also important components of the quality of life of New Zealanders.
Emissions from transport are a major contributor to poor air quality. Air quality, therefore is an issue of direct relevance to the social well-being and quality of life of the majority of New Zealanders. Changes in the number and types of vehicles on the road, urban congestion, and developments in technology, such as cleaner burning engines and alternative fuels, can impact on air quality.
Maintaining good drinking water quality is also a critical consideration for New Zealanders, since it is an important influence on health and therefore quality of life. Improvements in this indicator ensure that a smaller population is at risk of water-borne disease and other contaminants.
KEY POINTS
- Air quality, measured in terms of ambient concentrations of carbon monoxide (CO), is generally good. CO can be both a local problem around congested roads and an urbanwide problem when winter smog traps CO discharged from domestic fires and vehicles. New Zealand's maritime climate and a relatively low level of industrialisation ensure that we compare favourably with many other nations on this measure. However, unacceptable levels of air pollution sometimes occur in localised urban areas, mainly in congested traffic corridors. The indicators established to date are representative of urban areas where the carbon monoxide levels are likely to be higher than many in New Zealand. Pressures on air quality in the future may arise through population pressures and increases in the standard of living, which tend to increase vehicle numbers and emissions, the main source of air pollutants in the urban environment.
- Drinking water quality in New Zealand is considered to be high by international standards. Three-quarters of the population who have access to a community supply have drinking water with no micro-organisms such as Giardia and Cryptosporidium. In most other cases, investigations into the reasons for non-compliance show that it is largely a consequence of water suppliers failing to comply with monitoring standards rather than the water supply actually being contaminated.
SUMMARY
New Zealanders, by and large, cherish and understand their physical environment in terms of "clean and green". The measurements of air quality indicate that much of New Zealand has limited air pollution problems, although localised problem areas are apparent. Future pressures on air quality may emerge from the transport sector. Drinking water quality is good by international standards and reflects increased monitoring and infrastructure development, and improved conservation practices and attitudes.
There are regional differences in air quality. The Auckland region has both a high population and high population growth, resulting in high vehicle numbers and urban pollution. Christchurch also experiences air quality problems from time to time due to local geography and climatic conditions, rather than demographic change. Water quality also varies from region to region although general improvement is expected as local authorities implement more stringent water quality guidelines.
Air quality
DEFINITION
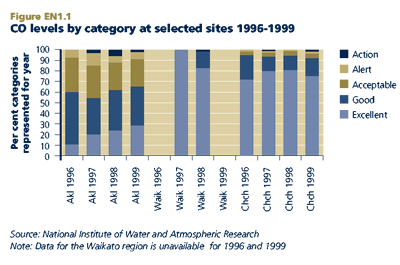
The ambient levels of carbon monoxide (CO) concentration, by category, at monitored sites around New Zealand between 1996 and 1999. The recommended guideline or maximum threshold for carbon monoxide is 10 mg/m3 averaged over an eight-hour period.
The categories of CO concentration (as a percentage of the maximum threshold) are:
- excellent - less than 10 per cent
- good - between 10 and 33 per cent
- acceptable - between 33 and 66 per cent
- alert - between 66 and 100 per cent
- action - more than 100 per cent
The indicators established to date are currently limited to the Auckland, Waikato and Christchurch regions. However, given the high traffic density in Auckland and the use of open fires in the low wind environment of Christchurch, these two sites are likely to represent the worst case CO pollution environments.
RELEVANCE
Good air quality is an important component in maintaining our quality of life, the appeal of New Zealand as a tourist destination, and the health of people, plants and animals. Poor air quality in New Zealand is often associated with urban areas where motor vehicles are a major contributor to air pollution.
Carbon monoxide is one of the key pollutants associated with this source. Pedestrians, vehicle commuters, inhabitants of office buildings and residents along busy traffic corridors can be exposed to elevated levels of CO. In humans, prolonged CO exposure at moderate levels can lead to symptoms such as headaches, dizziness, weakness, nausea and confusion6. Smokers, the elderly, and those with respiratory or heart conditions are most at risk.
CURRENT LEVEL AND TRENDS
In 1999 CO levels in both Auckland and Christchurch remained below the "action" guideline level for 99 per cent of the time. In Christchurch, the guideline was exceeded one per cent of the time in 1997. In Auckland, the guideline was exceeded 2.5 per cent of the time in both 1997 and 1998.
Data is only available for two years in the Waikato region. In 1997, the region was rated "excellent" for the entire year while in 1998 this rating applied 83 per cent of the time. For 17 per cent of the time in 1998, air quality was classified as either "good" or "acceptable" and the maximum guideline was not exceeded.
INTERNATIONAL COMPARISONS
As a broad generalisation, the air quality in New Zealand's urban areas is comparable with or better than a number of OECD countries. On a per capita basis, New Zealand emits below the average OECD level for carbon monoxide7. Ambient air quality is generally good due to New Zealand's remote location, maritime climate and relatively low level of industrialisation.

Drinking water quality
DEFINITION
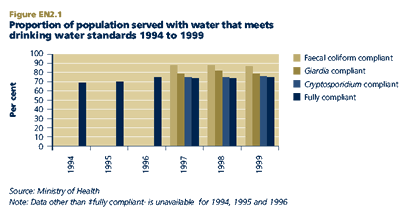
The percentage of the population who receive drinking water that fully complies with the Drinking Water Standards of New Zealand 1995. About 85 per cent of the New Zealand population drink water from community supplies.
RELEVANCE
Maintaining good drinking water quality is critical for human health and quality of life outcomes. The health risk to consumers from waterborne disease in drinking water supplies comes from three main microbiological organisms: faecal coliforms, Giardia, and Cryptosporidium. Improvements in this indicator ensure that less of the population is at risk of water-borne disease and other contaminants.
Water is of particular significance to Māori, who believe that all elements of the environment, including water, possess a life force or "mauri". Good quality drinking water is therefore an essential component of New Zealanders' physical, social and cultural well-being.
CURRENT LEVEL AND TRENDS
The majority of New Zealanders are supplied with community drinking water that is free of micro-organisms. The proportion of New Zealanders whose drinking water fully complies with the 1995 Drinking Water Standards rose from 69 per cent in 1994 to 75 per cent in 1999. Most water supplies serving large population areas are fully compliant with the 1995 standards. The main reason for non-compliance is inadequate monitoring rather than actual contamination of drinking water.
While the proportion of consumers with fully compliant drinking water supplies has remained fairly flat since 1996, this reflects the replacement of the 1984 standards with the more stringent standards adopted in 1996 rather than any decline in water treatment over this time.

REGIONAL DIFFERENCES
Groundwater sources supply drinking water for about 40 per cent of the New Zealand population, while about 60 per cent are supplied from surface (catchment) water. Most regional areas have good quality water in catchment headwaters, although regions with problems with groundwater quality have been identified.
There is considerable regional variation in the population served with drinking water that is fully compliant. In 1999 ten per cent or less of the populations in the Rotorua, Southland, Otago, Marlborough, and South Canterbury regions were served with drinking water that fully complied with the Drinking Water Standards 1995.
Where drinking water quality is affected, the agricultural sector is seen as the most important source of water quality problems.
INTERNATIONAL COMPARISON
Overall, the quality of New Zealand water is high by international standards. New Zealand's water supplies are free of many of the diseases that result in sickness and death in other countries. However, the incidence of infection from Giardia in water supplies is 85 per 100,000 people, which is considered high compared to the reported rates for other western countries.
