
Civil and Political Rights
Desired Outcomes
All people enjoy civil and political rights. The principles of the Treaty of Waitangi are recognised and incorporated into government decision-making.
Introduction
The enjoyment of civil and political rights is crucial to people's ability to participate in society, make choices about their lives, and live with dignity.
Civil and political rights fall into two broad categories. The first requires that people are protected from interference or abuse of power by others. The second requires that society is organised in a way that enables all people to develop to their full potential.40
Rights are defined in various international treaties and in domestic legislation. The New Zealand Bill of Rights Act 1990 sets out many rights New Zealanders enjoy. These include rights to life and security, voting rights, and rights to freedom of expression, peaceful assembly, association, thought, conscience, religion and belief. They also include rights to freedom from discrimination, and various rights relating to justice and criminal procedures. Other laws, such as the Privacy Act, also provide protection for specific rights.
New Zealand has also signed six core United Nations treaties, covering civil and political rights; economic, social and cultural rights; the elimination of racial discrimination and discrimination against women; the rights of children; and protection against torture and other cruel, inhuman or degrading treatment.
In addition, the United Nations draft Declaration on the Rights of Indigenous Peoples (still under negotiation) sets out several rights including: the right to preserve their cultures; rights to self-determination and to participate in wider society; rights relating to preservation and practice of their religion, language and education; and rights to have treaties honoured.41
The Treaty of Waitangi defines the relationship between Māori and the Crown. Its principles have been defined to include: a relationship in the nature of partnership between the Crown and Māori, including a responsibility to act reasonably, honourably and in good faith towards each other; active protection of Māori interests by the Crown; and redress of past wrongs.42
Civil and political rights are important for wellbeing in many ways. At a fundamental level, they protect people's lives and their physical wellbeing (for example, by recognising rights to freedom from torture and arbitrary arrest).
Wellbeing depends on people having a sense of choice or control over their lives, and on being reasonably able to do things they value, all of which are impossible without the exercise of the many rights referred to above.43 People's ability to take part in society, and their senses of belonging and identity also depend on the exercise of these rights.
Indicators
New Zealand is internationally recognised as having an excellent human rights record.44 The court system is independent and courts can enforce the rights affirmed in the New Zealand Bill of Rights Act, although there is no power to strike down legislation inconsistent with the Act. Other institutions exist to protect people from government power (examples include the Privacy Commissioner and the Ombudsmen) or to prevent and deal with instances of discrimination (such as the Human Rights Commission and Human Rights Review Tribunal). New Zealand regularly reports to the United Nations on its record in protecting rights.
However, direct measurement of civil and political rights is not a simple matter.
This chapter uses three indicators to provide some picture of how New Zealand's formal commitments to civil and political rights are reflected in reality. They are: voter turnout at general elections; the number of women represented in elected government positions; and perceived discrimination. These measure particular aspects of New Zealand's record without providing a comprehensive picture.
A key right in any democracy is the right to vote. The inclusion of voter turnout figures provides an indication of the level of trust and confidence voters have in the nation's political institutions. High voluntary voter turnout rates are an indication people see these institutions as relevant and meaningful to them, and they believe their vote can have influence.
An effective and relevant political system should broadly reflect the society it represents. The second indicator measures the proportion of women in elected positions in government.
Measuring the extent to which New Zealanders actually experience discrimination is problematic. Some research has suggested that for every 100 people who are discriminated against, only one will make a complaint.45 Perceived discrimination is a subjective measure of people's views about the level of discrimination against different groups in New Zealand society.
Voter turnout
Definition: General elections: The proportion of the estimated voting age population (aged 18 and over) who cast a valid vote in general elections. Local authority elections: The proportion of all enrolled electors (both resident and ratepayer) who cast a vote in contested local authority elections.
Relevance: Voter turnout rates are a measure of political participation. They can be seen as an indicator of the extent to which citizens feel part of the political process, and an indicator of the level of trust in political institutions.
Current Level and Trends
1. General elections
Voter turnout of the eligible population was 72.5 percent in 2002. Voter participation in general elections declined sharply from 89 percent in 1984 to 78 percent in 1990, increased slightly to 81 percent in 1996, then declined again to a new low in 2002.
Figure CP1.1
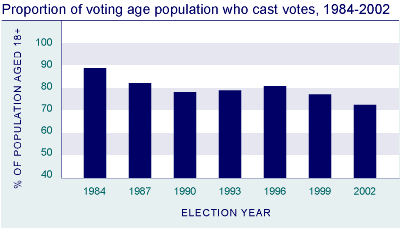
Source: Electoral Commission
2002, p 174. 1984 figure calculated by Ministry of Social Development
Comparisons Between Groups
Because of the nature of the secret ballot, information on differences in participation rates among various sectors of the New Zealand population is not directly available. Nevertheless, results from several New Zealand Election Surveys over a number of years associate a number of social, demographic, and occupational characteristics with impacts on the voter turnout rate. Non-voters are more likely to be people on lower incomes, younger people, and members of Māori or Pacific ethnic groups. There are few differences in voting turnout rates between men and women.46
Regional Dif ferences
There are few discernible differences in voting turnout rates between rural and urban voters, although non-voting tends to be lowest in provincial cities.
International comparison
New Zealand's voting turnout in national elections is considered high when compared with other Western democracies.47 In line with political participation trends in other OECD countries, voter turnout in New Zealand has been declining slowly.
Current levels and trends
2. Local authority elections
There are 252 elected local authorities in New Zealand : 12 regional councils, 21 district health boards (established 1 January 2001), 15 city councils, 59 district councils and 146 community boards. There was a major restructuring of local government in 1989.
Voter turnout in the 2001 local authority elections was the lowest since 1989 for all except regional councils, which had the second lowest since then.
Table CP1.1 Voter turnout (%) in local authority elections, 1989-2001
| 1989 | 1992 | 1995 | 1998 | 2001 | |
|---|---|---|---|---|---|
| Regional Councils | 56 | 52 | 48 | 53 | 49 |
| District health boards | 50 | ||||
| Territorial authorities | |||||
| City Councils | 52 | 48 | 49 | 51 | 45 |
| City mayors | 50 | 48 | 49 | 51 | 45 |
| District concils | 67 | 61 | 59 | 61 | 57 |
| District mayors | 67 | 61 | 59 | 59 | 56 |
| Community boards | 54 | 49 | 50 | 50 | 46 |
Source: Department of Internal
Affairs (2003), Table 7.1 |
|||||
Local authority voter turnout is generally highest for district councils, with their more rural population base, for smaller city councils and those in the South Island. Councils of these types all had a majority turnout in 2001, while among large city councils and North Island city councils, fewer than half of eligible electors voted. Voter turnout ranged from 65 percent for district councils in the South Island, to 43 percent for city councils in the North Island.
In large regional councils, there was an upward trend in voter turnout between 1995 and 2001. However, the average turnout was still higher among small regional councils. Similarly, voter turnout was highest on average among the smaller district health boards.
Representation of women in government
Definition: The proportion of elected members of parliament and local government bodies who are women.
Relevance: The representation of women in government can be seen as an indicator of political representation more generally. Representative political institutions engage a wide range of communities in the political process, draw on the talents and skills of the broadest group of people, and provide checks and balances on the use of political power.
Current Level and Trends
1. General elections
As a result of the 2002 general election, women hold 34 of the 120 seats in Parliament, or 28 percent. Under the first-past-the-post electoral system, women's representation in parliament increased from 13 percent in 1984 to 21 percent in 1993. In the first mixed member proportional election held in 1996, this rose sharply to 29 percent. There was a further small rise to 31 percent in 1999, followed by a decline to 28 percent in 2002.
In 1996, women made up a far higher proportion of list MPs than electorate MPs (46 percent, compared to just 15 percent of electorate MPs). However, by 2002, the female proportions were similar in both categories.
The majority of women elected to parliament in 2002 were electorate MPs (56 percent). The proportion of female MPs who were electorate MPs has increased from 29 percent in 1996 and 43 percent in 1999.
Figure CP2.1
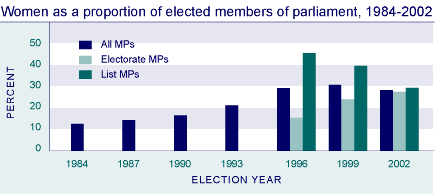
Source: Electoral
Commission (2002), p 176
International comparison
In 2003, New Zealand ranked 15th equal (with Spain) in the world for women's representation in parliament, and ninth among the 30 OECD countries. Countries with higher female representation include Sweden (the highest, at 45 percent), Denmark and Finland (38 percent), the Netherlands (37 percent), Norway and Cuba (36 percent), Costa Rica and Iceland (35 percent).
Current Level and Trends
2. Local government elections
In the 2001 local government elections, 615 women were elected to local authorities and they made up 31 percent of elected members. The representation of women among those elected increased from 25 percent in 1989 to 32 percent in 1998, then fell slightly to 31 percent in 2001. In the 1980s, women were more highly represented in local government than in national government but the difference has narrowed over time.
Women candidates were more likely than male candidates to be elected in each election year from 1989 to 1998, but this was reversed in 2001, when 40 percent of women candidates were elected, compared to 43 percent of men.
In 2001, female representation was highest on district health boards (44 percent), followed by city councils (39 percent) and community boards (31 percent). City councils were the only local authorities to see an increased share of women elected in 2001.
The number of women elected to city council mayoral positions has remained steady at four (out of 15) for most election years since 1989. In contrast, the number of women mayors in district councils increased rapidly from six (out of 59) in 1989 to 15 in 1998, then fell sharply to eight in 2001.
Table CP2.1 Proportion (%) of members who were women, by type of body, 1989-2001
| 1989 | 1992 | 1995 | 1998 | 2001 | |
|---|---|---|---|---|---|
| Regional councils | 22 | 25 | 29 | 28 | 26 |
| District health boards | 44 | ||||
| City councils | 35 | 35 | 33 | 36 | 39 |
| District councils | 19 | 23 | 26 | 27 | 25 |
| Community boards | 29 | 32 | 33 | 35 | 31 |
Source: Department of Internal Affairs (2003), Table 5.4 |
|||||
Table CP2.2 Women mayors, 1989-2001
| 1989 | 1992 | 1995 | 1998 | 2001 | |
|---|---|---|---|---|---|
| City councils | 4/14 | 4/15 | 3/15 | 4/15 | 4/15 |
| District councils | 6/59 | 9/59 | 12/59 | 15/59 | 8/58* |
Source: Department of Internal
Affairs (2003), Table 5.5 |
|||||
Perceived discrimination
Definition: The proportion of people aged 18 and over who perceived selected groups as being the targets of discrimination (ie subject to some discrimination, or a great deal of discrimination).
Relevance: Surveys on perceived discrimination of groups of people provide one indication of the level and type of discrimination in New Zealand . They do not measure actual levels of discrimination.
Current Level and Trends
In January 2003, more than three quarters of survey respondents (79 percent) thought that Asian people were subject to a great deal or some discrimination, the highest proportion for any group. This was followed by recent immigrants (77 percent) and refugees (72 percent). Perceived discrimination against these groups has increased since December 2001, from 73 percent for Asians, and from 68 percent for recent immigrants and refugees.
Table CP3.1 Proportion (%) of survey respondents who perceived selected groups as being subject to a great deal or some discrimination, December 2000-January 2003
| Group | Dec 2000 | Dec 2001 | Jan 2003 |
|---|---|---|---|
| Asians | 73 | 73 | 79 |
| Recent Immigrants | 68 | 77 | |
| Refugees | 68 | 72 | |
| People on welfare | 75 | 70 | 68 |
| People who are overweight | 72 | 65 | 65 |
| Pacific Peoples | 71 | 65 | 65 |
| Gays and lesbians | 74 | 65 | 61 |
| Māori | 70 | 62 | 57 |
| People with disabilities | 61 | 55 | 53 |
| Older people | 53 | 48 | 49 |
| Women | 50 | 44 | 41 |
Source: Human Rights Commission/UMR Research, 2003 |
|||
More than two thirds of survey respondents thought that Pacific peoples (71 percent) were the targets of discrimination and more than half (57 percent) thought that Māori were subjected to discrimination. The proportion who perceived these groups as being discriminated against has declined since December 2000.
Women, older people, people with disabilities, and gays and lesbians were all less likely to be considered the targets of discrimination in January 2003, compared to December 2000. These results do not measure actual levels of discrimination against groups of people. Therefore, it is not possible to conclude whether actual levels of discrimination against these groups have declined.