Cultural Identity
Desired Outcomes
New Zealanders share a strong national identity, have a sense of belonging, and value cultural diversity. Māori, European/Pākehā, Pacific people, and other groups and communities are able to pass different cultural traditions on to future generations. Māori culture is valued and protected.
Introduction
'Culture' refers to the customs, practices, languages, values and world views that define social groups such as those based on ethnicity, region, or common interests. Cultural identity is important for people's sense of self and how they relate to others. A strong cultural identity can contribute to people's overall wellbeing.
Cultural identity is not exclusive. People may identify themselves as New Zealanders in some circumstances and as part of a particular culture - Māori, Chinese or Scottish, for example - in other circumstances. They may also identify with more than one culture.
The desired outcomes recognise it is important for people to feel a sense of national identity and also to be able to belong to particular social or ethnic groups. They recognise New Zealand as a multicultural society, while also acknowledging that Māori culture has a unique place. Under the Treaty of Waitangi, the Crown has an obligation to protect the Māori language and culture.
Defining a national identity is not a simple matter. New Zealand is a diverse nation, made up of many cultural groups, with many different customs and traditions. Many people identify their ethnicity in censuses as 'New Zealander', but how they define their 'New Zealand-ness' may vary from person to person. For example, they might see a New Zealand identity in aspects of New Zealand history, in New Zealand achievements in artistic or other endeavours, through a sense of national characteristics or traits, or through national symbols and icons. Māori culture may form one aspect of national identity, since it is unique to New Zealand and forms part of our identity in the outside world.
Cultural identity is an important contributor to people's wellbeing. Identifying with a particular culture gives people feelings of belonging and security. It also provides people with access to social networks which provide support and shared values and aspirations. These can help break down barriers and build a sense of trust between people - a phenomenon sometimes referred to as social capital - although excessively strong cultural identity can also contribute to barriers between groups. An established cultural identity has also been linked with positive outcomes in areas such as health and education.48
Conversely, members of minority cultures can feel excluded from society if the majority of those in authority obstruct or are intolerant of their cultural practices, as happened to the Māori language and culture through much of New Zealand's history.
Culture can also play a part in promoting social wellbeing in other ways. A strong national culture or identity, and strength in artistic endeavours, can be a source of economic strength and higher material standards of living.
Indicators
Four indicators are used. They are: participation in cultural and arts activities; the proportion of Māori language speakers; the proportion of Māori and Pacific children receiving Māori and Pacific medium education; and local content programming on television.
While they cannot provide an exhaustive picture of New Zealand's cultural identity, they do provide snapshots of the health of particular aspects. There is a strong focus on the health of the Māori culture.
Culture is much broader than artistic endeavours. However, the arts often explore cultural identity and can contribute to it. Many people define their culture at least partly by its music, art, literature and other artistic endeavours. The first indicator, the number of people taking part in cultural and arts activities, provides a measure of this aspect of cultural life. This indicator includes information about participation in Pacific and Māori culture and arts activities, providing some indication of the value New Zealanders place on cultural diversity.
The second indicator measures the current health of the Māori language. Language is a central component of culture and a necessary skill for full participation in Māori society.
The proportion of Māori and Pacific children receiving Māori and Pacific medium education is a measure of the future health of the Māori language. It also provides some indication of the general ability of both Māori and Pacific people to pass on their cultural practices.
The final indicator, the amount of New Zealand content on television, provides one way of measuring the strength of New Zealanders' sense of national identity.
Participation in cultural and arts activities
Definition: The proportion of the population aged 15 and over who had experienced one or more of the cultural activities included in the 2002 Cultural Experiences Survey. Respondents were asked to report on activities they experienced over either a 12 month period (for goods and services accessed or experienced relatively infrequently) or a four week recall period (for activities experienced on a more regular basis).
Relevance: Cultural activities are an integral part of our lives and help to define who we are as New Zealanders. People participate in cultural activities for a wide variety of reasons: for enjoyment and entertainment; for personal growth and development; as a means of expression; to learn new skills and to meet new people; and to pass on cultural traditions.
Current Level
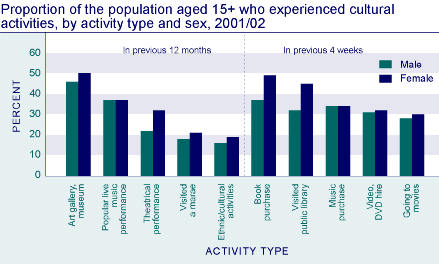
The vast majority of New Zealanders aged 15 and over (93 percent or 2.6 million people) experienced one or more of the cultural activities included in the 2002 Cultural Experiences Survey. The most popular of the less frequent activities included in the survey (those experienced over the past year) were visiting an art gallery or museum (48 percent) and attending a popular live music performance (37 percent). The most popular activities undertaken in the previous four weeks were purchasing books (43 percent) and visiting a public library (39 percent). Lack of time and cost were the main barriers to experiencing cultural activities more often, or at all.
Figure CI1.1

Source: Statistics New Zealand 2002
Sex and Age Differences
Women (95 percent) were slightly more likely to experience one or more of the cultural activities included in the survey than men (92 percent). Activities with a much higher proportion of women than men participating included purchasing a book, visiting a library, and going to a theatrical performance. There was no difference in the proportion of men and women who had purchased music.
Younger people were more likely to experience at least one of the cultural activities included in the survey than people in the older age groups. In 2002, virtually all 15-24 year olds (98 percent) and 96 percent of 25-44 year olds took part in one or more of the surveyed activities. Participation was lowest among the 65+ age group (81 percent). Popular activities among younger people included hiring a video or DVD (53 percent) and purchasing music (49 percent). Older people (65+ years) were more likely to visit a public library than other age groups with 46 percent reporting this activity.
Ethnic Differences
Māori were more likely to have participated in at least one of the cultural activities included in the survey than the European or Pacific groups (Māori 97 percent; European 93 percent; Pacific 92 percent). Popular activities experienced by Māori included visiting a marae (69 percent) and attending a popular live music performance (40 percent). European New Zealanders were more likely to report visiting an art gallery or museum than other groups (51 percent), while Pacific people had the highest rate of participation in community-based ethnic or cultural activities (39 percent).
Table CI1.1 Proportion (%) of population aged 15+ who had participated in cultural activities by activity type and ethnic group
| Māori | Pacific people | European | |
|---|---|---|---|
In the previous 12 months |
|||
| Art gallery/museum | 42 | 27 | 51 |
| Book purchase | 40 | 29 | 45 |
| Popular live music performance | 40 | 27 | 39 |
| Theatrical performance | 18 | 19 | 30 |
| Visited a marae | 69 | 22 | 14 |
| Community-based ethnic/cultural activities | 20 | 39 | 14 |
In the previous four weeks |
|||
| Visited a public library | 34 | 31 | 39 |
| Music purchase | 32 | 33 | 34 |
| Video, DVD hire | 39 | 26 | 31 |
| Going to movies | 23 | 21 | 30 |
Any cultural activity |
97 | 92 | 93 |
Source: Statistics New Zealand 2002 |
|||
Regional Differences
In 2002, 94 percent of people living in urban areas experienced one or more of the cultural activities included in the survey, compared to 93 percent of people living in secondary urban areas and 91 percent of those living in minor urban and rural areas. Comparing across regional council areas, Wellington had the highest proportion of people who experienced at least one of the surveyed activities (97 percent), while Taranaki had the lowest level of participation (87 percent). In part, this may reflect differences in the level of activities that are available in these areas.
Māori language speakers
Definition: The number of Māori who reported in the census they could hold a conversation about everyday things in Māori, as a proportion of the Māori population.49
Relevance: As a central component of Māori culture, Māori language is an important aspect of participation and identity. The Māori language forms part of the broader cultural identity and heritage of New Zealand and in 1987 was granted the status of an official language of New Zealand .
Current Level
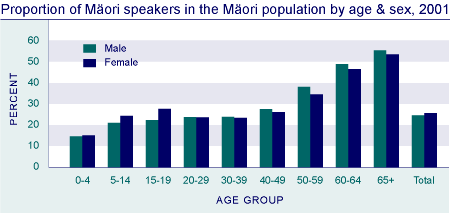
The 2001 census showed that one-quarter of all Māori (25 percent or 130,482 Māori) and 28 percent of Māori aged 15 and over (or 91,809) stated they could hold a conversation in Māori about everyday things. Māori accounted for 81 percent of the total number of Māori language speakers (160,500). The 1996 census also showed that the proportion of Māori who speak te reo was around 25 percent, but because of changes in the census ethnicity measures this figure is not directly comparable with the figure for 2001.
The proportion of Māori who were fluent Māori speakers declined markedly over the last century, particularly following the rapid urbanisation of the Māori population in the 1950s and 1960s. The first national Māori language survey in 1973 estimated that the proportion of fluent speakers had fallen to 18 percent.
Information on the fluency of Māori speakers is available from the survey of the health of the Māori language, conducted in 2001. The survey showed that more people could understand Māori (59 percent of Māori aged 15 years and over, or 190,209) than speak it (42 percent, or 136,600). In terms of proficiency, while 42 percent could speak some Māori, only nine percent could speak Māori 'well' or 'very well', 11 percent could speak Māori 'fairly well', and 22 percent could speak Māori but 'not very well'. Similarly, while 59 percent of people could understand Māori, only 15 percent could understand Māori 'well' or 'very well', 18 percent could understand Māori 'fairly well', and 25 percent could understand Māori but 'not very well'.50
Figure CI2.1

Source: Statistics New
Zealand 2001 census
Ethnic Differences
The 2001 census showed that 4.5 percent of the total population could hold a conversation in Māori. After Māori, Pacific peoples had the highest proportion who could speak Māori (5.8 percent), followed by Europeans (1.7 percent) and Asians (0.8 percent).
Age and Sex Differences
Older Māori are considerably more likely than younger Māori to be able to converse about everyday things in Māori. In the 2001 census, more than half of Māori aged 65 and over (54 percent) reported having conversational fluency in the Māori language, compared with less than one quarter (22 percent) of Māori under 40.
Sex differences in the proportion of Māori language speakers were also apparent. From age 40 years onwards, males were more likely than females to be Māori language speakers, while at younger ages (below 20 years) a higher proportion of females than males could speak Māori.
Among non-Māori, the proportion of Māori language speakers was higher at the younger ages. Females were also more likely to be Māori language speakers than males.
Table CI2.1 Proportion (%) of Māori speakers in the Māori population, by age and sex, 2001
| Age group (years) | ||||||||||
|---|---|---|---|---|---|---|---|---|---|---|
| 0-4 | 5-14 | 15-19 | 20-29 | 30-39 | 40-49 | 50-59 | 60-64 | 65+ | Total | |
| Male | 14.6 | 21.2 | 22.3 | 23.8 | 24.0 | 27.6 | 38.1 | 48.9 | 55.3 | 24.6 |
| Female | 15.1 | 24.4 | 27.7 | 23.6 | 23.5 | 26.1 | 34.5 | 46.5 | 53.5 | 25.7 |
| Total | 14.8 | 22.7 | 25.0 | 23.7 | 23.8 | 26.8 | 36.3 | 47.7 | 54.3 | 25.2 |
Source: Statistics New Zealand, 2001 census |
||||||||||
Regional Differences
Māori who live in areas with a high proportion of Māori residents are the most likely to be Māori language speakers. Regions with higher than average proportions of Māori with conversational Māori skills were Gisborne (35 percent), Bay of Plenty (32 percent), Northland (30 percent), Waikato (28 percent) and Hawkes Bay (27 percent).
Māori and Pacific children receiving Māori medium and Pacific medium education
Definition: The number of Māori and Pacific enrolments in language immersion early childhood education services as a proportion of all Māori and Pacific early childhood education enrolments; the number and proportion of Māori and Pacific school students receiving Māori medium or Pacific medium education in which all or some curriculum subjects are taught in their respective languages.
Relevance: Knowledge of language is an important prerequisite for participating in one's culture and maintaining cultural identity. Māori and Pacific communities have initiated language programmes to develop the language skills of their young people.
Current Level and Trends
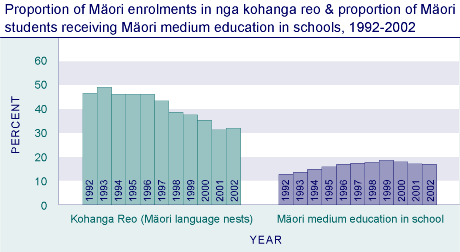
In July 2002, there were 10,503 enrolments of Māori children in kōhanga reo (Māori 'language nests') and they made up 32 percent of all Māori enrolments in early childhood education. Although Māori children's participation in early childhood education has continued to rise over time, the share of enrolments in kōhanga reo has declined, while the proportion in education and care centres has increased. However, the majority of Māori children enrolled in early childhood education (over 80 percent) attend centres that provide at least some Māori medium experience. In 2002, there were a further 247 enrolments in other Māori immersion early childhood education services (with 81-100 percent of instruction in Māori), and 16,387 enrolments in bilingual services where Māori is the medium of instruction for between 12-80 percent of teacher contact time.
Figure CI3.1

Source: Ministry of Education
Note: Changes in counting methods affect the comparability of kōhanga reo data before and after 1998, and Māori medium
data before and after 1999. Kōhanga reo figures refer to Māori enrolments in kōhanga as a proportion of all Māori enrolments
The 2,749 enrolments of Pacific children in Pacific language nests in July 2002 accounted for 24 percent of all Pacific enrolments in early childhood education at that time, down from 46 percent in 1992.51 Enrolments in Pacific language nests have declined as a proportion of all Pacific enrolments, while enrolments in education and care centres have increased. In all, there were 1,382 enrolments in Pacific language immersion services in July 2002, and 1,722 enrolments in bilingual services. Samoan is the language of instruction in the majority of Pacific medium early childhood services, followed by Tongan, Cook Island Māori, and Niuean.
In 2002, 17 percent of Māori school students (25,654) were involved in Māori medium education. The number of mainstream schools offering Māori medium education increased significantly following the introduction in 1989 of targeted funding to promote the Māori language. By 1999, 19 percent of Māori students (26,852) were receiving some of their education in the Māori language, a substantial increase from 13 percent (16,051) in 1992.
Kura kaupapa Māori are schools in which Māori language, culture and values predominate and in which the principal language of instruction is Māori. The number of kura kaupapa Māori has increased from 13 in 1992 to 61 in 2002. Over the same period, the number of Māori enrolments in kura kaupapa Māori increased tenfold, from 507 in 1992 to 5,401. In 2002, an estimated four percent of all Māori students were enrolled in kura kaupapa Māori.
Table CI3.1 Number and proportion (%) of Māori students receiving Māori medium education in schools, selected years, 1992-2002
| Year | Some (at least 12%) Māori medium education |
More than 50% Māori medium education |
||
|---|---|---|---|---|
| 1992 | 16,051 | 12.7 | 8,862 | 7.0 |
| 1996 | 23,222 | 16.8 | 14,398 | 10.4 |
| 2001 | 25,580 | 17.1 | 16,460 | 11.0 |
| 2002 | 25,654 | 17.1 | 16,764 | 11.2 |
Source: Ministry of Education. 2002 percentages estimated by Ministry of Social Development |
||||
A total of 1,791 Pacific school children (about three percent of all Pacific school students) were involved in Pacific medium education programmes in July 2002. This represents an increase from 1,370 enrolled in 2000. About three-quarters (77 percent) were receiving instruction in Samoan.
Regional Differences
Involvement in Māori medium education is particularly high in the Gisborne, Bay of Plenty, and Hawkes Bay regions, where almost three in 10 students are receiving some school instruction in Māori. Other regions with high levels of involvement are Northland and Manawatu/Whanganui. A similar pattern holds for kōhanga reo enrolments.
Local content programming on New Zealand television
Definition: The number of hours of local content screened on New Zealand television channels during prime time, as a proportion of the total prime time schedule, between 1988 and 2002. Local content is generally defined as material that is both predominantly made in New Zealand and reflective of New Zealand identity and culture.
Relevance: Television plays a dominant role in our lives. Ninety eight percent of New Zealand households have at least one television set.52 For many people, television is a major source of news, information and entertainment and strongly influences their sense of local and national identity. A local content measure reflects the extent to which we see our culture reflected through this medium.
Current Level and Trends
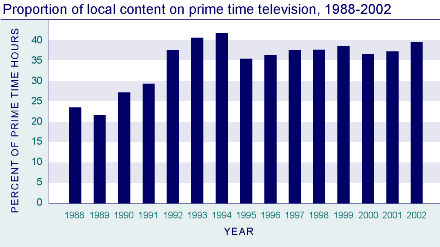
In 2002, local content on the three main television channels comprised 39.5 percent of the prime time schedule, an increase from 37.2 percent in 2000. The proportion of local content rose from 24 percent in 1988 to a peak of 42 percent in 1994, before dropping to 35 percent in 1995.
Figure CI4.1

Source: New Zealand on Air
Note: These figures are for local content on TV One, TV2, and TV3 only
Since 1988, other free-to-air broadcasters (including TV4, MTV and a number of regional channels) as well as pay-television channels Sky (satellite) and Saturn (cable) have joined the three national television channels.
Table CI4.1 Percentage share of local content by programme type, 1988-2002
| Programme type | % | ||||||||
|---|---|---|---|---|---|---|---|---|---|
| 1988 | 1990 | 1996 | 1997 | 1998 | 1999 | 2000 | 2001 | 2002 | |
| News, current affairs | 26 | 23 | 24 | 26 | 28 | 30 | 30 | 33 | 29 |
| Information | 10 | 5 | 17 | 20 | 24 | 19 | 17 | 21 | 18 |
| Sports | 24 | 39 | 21 | 15 | 16 | 16 | 20 | 13 | 18 |
| Entertainment | 14 | 12 | 6 | 9 | 7 | 8 | 7 | 9 | 10 |
| Children's | 15 | 13 | 15 | 14 | 10 | 10 | 10 | 8 | 8 |
| Drama/comedy | 2 | 1 | 7 | 6 | 6 | 6 | 6 | 6 | 6 |
| Māori | 6 | 3 | 4 | 5 | 4 | 5 | 6 | 6 | 5 |
| Documentaries | 2 | 3 | 5 | 5 | 5 | 5 | 4 | 4 | 5 |
| Children's Drama | 1 | 1 | 0 | 0 | 0 | 0 | 0 | 0 | 0 |
| Total New Zealand content hours | 2,112 | 4,249 | 5,066 | 5,601 | 6,296 | 6,143 | 6,185 | 6,190 | 7,201 |
Source: New Zealand on Air |
|||||||||
Three programme types account for two-thirds of local content hours: news and current affairs (29 percent); information programmes (18 percent); and sports (18 percent).
International Comparison
International comparisons are difficult due to inconsistencies in measurement approaches by different countries. Available figures suggest that, while local content on New Zealand television is steadily increasing, it accounts for less than a quarter of total transmission time, compared to Canada (60 percent), Norway (56 percent), Finland (55 percent), Australia (55 percent) and Ireland (41 percent).
