
Economic Standard of Living
Desired Outcomes
New Zealand is a prosperous society where all people have access to adequate incomes and enjoy standards of living that mean they can fully participate in society and have choice about how to live their lives.
Introduction
Economic standard of living concerns the physical circumstances in which people live, the goods and services they are able to consume, and the economic resources they have access to. It is concerned with both the average level of resources in New Zealand as well as the distribution of those resources across New Zealand society.
Basic necessities such as adequate food, clothing and housing are fundamental to wellbeing. Economic standard of living also contributes to people's feelings of contentment, belonging, status, empowerment, security and overall wellbeing.
The desired outcomes place particular emphasis on two aspects of wellbeing: participation in society, and choice. Participation refers to people's ability to take part in and contribute to all of the spheres of life they value, whether as parents and family members, friends and neighbours, in work or training, or in leisure or community groups. The 1972 Royal Commission on Social Policy defined participation as meaning "no-one is so poor that they cannot eat the sort of food that New Zealanders usually eat, wear the same sort of clothes, [and] take a moderate part in those activities which the ordinary New Zealander takes part in as a matter of course."34
Choice is about people's ability to influence the course of their lives, whether that refers to where they live, what they own, what they do with their time, what they eat, where they go for holidays or any other aspect of life in which ability to command resources is a factor. Choice is important because a fundamental aspect of wellbeing is to have a sense of control over one's life, and also because the choices people make directly influence their levels of contentment. Many people measure their success in life by their material success and their ability to provide resources for themselves and their families.
Indicators
Six indicators are used in this chapter, each providing information on different aspects of economic standards of living. They are: market income per person; income inequality; proportion of the population with low incomes; proportion of the population with low living standards; housing affordability; and household crowding.
The focus is largely on objective measures of economic living standards, though one indicator (population with low living standards) takes into account people's subjective perceptions about how well off they are. Together, the indicators provide information about overall trends in living standards, levels of hardship, and how equitably resources are distributed. All are relevant to the adequacy of people's incomes and their ability to participate in society and make choices about their lives.
The focus of the first three is on incomes, while the remaining three are more direct measures of the material living standards people can achieve. This recognises that the same level of income can produce different living standards, depending on factors such as people's coping skills, their health status and the assets they own.
Market income per person gives an indication of the average level of income and therefore the overall material quality of life available to New Zealanders. This is an internationally-recognised measure, allowing comparisons between New Zealand and other nations. An estimate of the economic value of unpaid work is also provided.
Income inequality is measured by comparing the incomes of the top 20 percent of households with the incomes of the bottom 20 percent. High levels of inequality are associated with lower levels of social cohesion and personal wellbeing, even when less well off people have adequate incomes to meet their basic needs.
The proportion of the population with low incomes also provides information about how equitably resources are distributed and how many people are likely to be on incomes that don't allow full participation in society.
The population with low living standards provides a broad measure, taking into account the extent that people do without things and don't engage in social activities because of the cost, as well as measuring whether people feel their incomes are satisfactory.
Housing affordability measures the proportion of the population spending more than 30 percent of their income on housing. Housing costs have a major impact on overall material living standards.
The final indicator measures the number of people living in overcrowded houses. Housing is a basic need and this indicator provides a direct measure of the adequacy of housing people can afford.
Market income per person
Definition: Real gross national disposable income (RGNDI) is a measure of the total volume of goods and services available to New Zealanders. Because it is a measure of volume it is not affected by inflation. This indicator is RGNDI per person.
Relevance: Per capita national disposable income gives a measure of the average income available to New Zealanders. A nation with rising per capita RGNDI will have a greater capacity to deliver a better quality of life and standard of living to the population.
Current Level and Trends
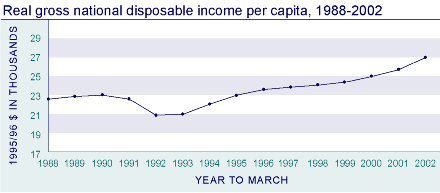
In 2002, RGNDI per person was $27,095 in constant 1995/96 dollars compared with $22,615 in 1988 (1995/96 dollars). This represents an average growth rate over the period of 1.4 percent per year. RGNDI grew slowly between 1988 and 1990, before falling to below its 1988 level by 1992. Since 1992, there has been steady growth. This growth reflects the slow but steady increase in the ratio of capital to labour, as well as increasing labour force participation and declining unemployment.
Figure EC1.1
Source: Statistics New
Zealand
International comparison
Comparisons with other OECD countries are available for the slightly different measure, real gross domestic product (GDP) per person. Using real GDP per person in current US dollars, adjusted for purchasing power parity, New Zealand ranked 21st out of 30 OECD countries in 2001 compared with 19th out of 26 countries in 1986 and 10th in 1970. Between 1986 and 2001, real GDP per person in New Zealand grew by 17 percent compared with an OECD average of 33 percent.
Economic Value of Unpaid Work
RGNDI does not take into account the value of unpaid work such as looking after one's own children, cooking meals at home, or voluntary work in the community. The estimated value of unpaid work in New Zealand in 1999 was $39,637 million (1998/99 dollars), equivalent to 39 percent of gross domestic product (GDP). This equates to an annual salary of $13,820 for the average unpaid household worker. Alternatively, the economic value of unpaid work is equivalent to $9,944 per capita (1995/96 dollars).
Income inequality
Definition: Income inequality refers to the extent of disparity between high and low incomes. The measure used here is the ratio of the 80th percentile to the 20th percentile of the household disposable income distribution (ie the ratio of a high household income to a low household income). The higher this ratio, the greater the level of inequality.
Relevance: The degree of income inequality is often regarded as an important aspect of the type of society we live in. A high level of income inequality may be detrimental to the level of social connectedness across society.
Current Level and Trends
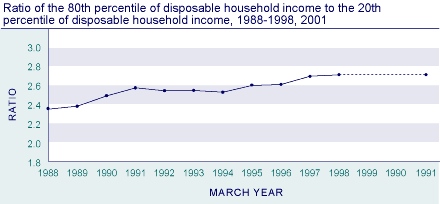
In 2001, the disposable income of a household at the 80th percentile was 2.7 times larger than the income of a household at the 20th percentile. In 1988, the ratio was 2.4. Income inequality rose between 1988 and 1991, then fell slightly, and has been rising since 1994. The rapid rise occurring between 1988 and 1994, was largely due to widespread economic reforms, combined with major changes to the social welfare system. The economic recession and large rise in unemployment exacerbated inequalities.
Most of the observed increase in inequality has been due to a relatively larger overall rise in the incomes of the top 20 percent of income earners, particularly between 1988 and 1990 and between 1994 and 1998. Incomes of those in the bottom 20 percent have remained approximately constant after adjusting for inflation over the whole period. The middle 60 percent experienced some slight decline between 1988 and 1994 followed by increases between 1994 and 1998.
Figure EC 2.1
Source: Derived from
Statistics New Zealand's Household Economic Survey by the
Ministry of Social Development
Note: 1. This measure does not adjust for household size
2. The weightings of the records in the sample have been revised for
all years since The Social Report 2001
Population with low incomes
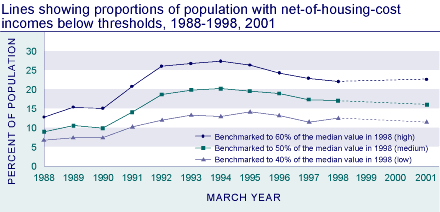
Definition: The proportion of the population in economic family units with equivalent income net of housing cost below three thresholds (low, medium, and high). The measures take account of incomes, housing costs and family size and are adjusted for inflation and taxes. The lines are specified in terms of constant-value thresholds. The benchmarks for the thresholds are 40 percent, 50 percent, and 60 percent of 1998 median equivalent net-of-housing-cost family incomes.
Relevance: Insufficient economic resources limit people's ability to participate and belong to their community and wider society and otherwise restrict their quality of life. Furthermore, a consistent finding across the literature on outcomes for children is that low family income in childhood, if it is long-lasting, is associated with negative outcomes, such as lower educational attainment and poor health.
Current Level and Trends
In the year to June 2001, 22.6 percent of the population were living below the 60 percent threshold, a slight increase on the proportion in the previous survey year to March 1998 (22.0 percent). On all three measures (low, medium, and high), the proportion of the population with low incomes increased sharply in the early 1990s, reached a peak in the mid-1990s, and declined over the latter half of the decade. However, in 2001, the proportion of the population below these thresholds was still substantially higher than it had been in 1988.
The increase in the proportion of the population with low incomes through the early 1990s is attributable to high rates of unemployment and declines in the level of social assistance. The recent improvement in this measure may likewise reflect more robust economic (and income) growth, and the steady decline in unemployment.
Figure EC3.1
Source: Derived from
Statistics New Zealand's Household Economic Survey, 1988-2001, by the
Ministry of Social Development
Population Group Differences
In 2001, 29.1 percent of dependent children were in economic family units below the 60 percent line (benchmarked to the 1998 median). This represents an increase from 27.5 percent in 1998 and is almost twice the proportion in 1988 (14.6), but substantially below the peak of 36.4 percent in 1994.
Higher than average likelihoods of being below the 60 percent line exist for sole parent families, families who rely on income-tested benefits as their main source of income, families with any Māori adult, Pacific adult, or adults belonging to the 'Other' ethnic group, those living in rented dwellings, and economic families with dependent children (in particular, large families). The proportion of all these groups below the 60 percent benchmark line declined from 1992 to 1998, although not back to 1988 levels. This downward trend continued to 2001 only for economic family units whose main income source was New Zealand Superannuation, those in rental housing, and those which included any Pacific or Other ethnic group adult. In contrast, the proportion of families with dependent children below the 60 percent line increased slightly over this period.
Table EC3.1 Proportion of population with net-of-housing-cost incomes below the 60 percent line (benchmarked to 1998 median), 1988, 1993, 1998, 2001
| 1987-88 | 1992-93 | 1997-98 | 2000-01 | |
|---|---|---|---|---|
| Total Population | 12.7 | 26.7 | 22.0 | 22.6 |
| Total dependent children | 14.6 | 34.7 | 27.5 | 29.1 |
| Children in sole parent families | 18.5 | 65.6 | 59.2 | 66.3 |
| Children in two parent families | 13.8 | 27.5 | 18.5 | 19.7 |
| Total economic families | 14.0 | 28.0 | 23.2 | 23.2 |
| Economic Families | ||||
| With one dependent child | 11.5 | 30.1 | 25.2 | 26.5 |
| With two dependent children | 11.7 | 32.9 | 23.5 | 26.0 |
| With three or more dependent children | 18.6 | 40.8 | 30.7 | 32.7 |
| Sole parent families | 17.4 | 62.5 | 51.9 | 59.4 |
| Two parent families | 12.4 | 25.1 | 17.0 | 17.5 |
| Economic Families | ||||
| With any Māori adult | 14.0 | 41.0 | 31.2 | 32.0 |
| With any Pacific adult | 24.4 | 48.9 | 44.3 | 40.0 |
| With any 'Other' ethnic group adult | 23.6 | 42.8 | 53.7 | 35.6 |
| With any European/Pākehā adult | 12.6 | 23.3 | 18.5 | 18.7 |
| Economic families with main source of income | ||||
| New Zealand Superannuation | 7.0 | 8.4 | 9.9 | 6.5 |
| Income-tested benefit | 26.0 | 74.3 | 61.7 | 61.6 |
| Housing Tenure (households with one family unit) | ||||
| Rented | n.a. | 43.3 | 37.2 | 33.5 |
| Owned with mortgage | n.a. | 24.3 | 15.3 | 17.1 |
| Owned without mortgage | n.a. | 4.9 | 3.7 | 5.6 |
Source: Derived from Statistics New Zealand Household Economic Survey, by Ministry of Social Development |
||||
International Comparisons
Based on a measure of 60 percent of median equivalent disposable household income in 1998, New Zealand ranked 12th out of 20 OECD countries. This represents a higher proportion of households with a low (relative) income than the majority of European countries and Canada, on a par with Australia, and less than the United Kingdom and the United States. Measured at 50 percent of median equivalent disposable household income New Zealand ranked 9th out of 20 OECD countries. Note that neither of these comparisons take account of housing costs.
Population with low living standards
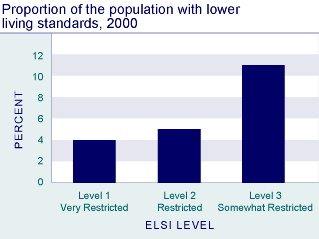
Definition: The proportion of the population with a 'somewhat restricted', 'restricted', or 'very restricted' standard of living: Levels 1-3 of the Economic Living Standard Index (ELSI).
Relevance: The Economic Living Standard Index is an indicator of how people are living in terms of their possessions, activities and how they get by financially. Having a low living standard limits a person's ability to participate in the wider society, curtails quality of life, and can have negative long-term consequences across a wide range of social and economic outcomes.
Current Level
In 2000, four percent of the total population had 'very restricted' living standards, five percent had 'restricted' living standards and a further 11 percent had 'somewhat restricted' living standards. In total, 20 percent of the population had living standards in the bottom three levels of the ELSI scale.
Figure EC4.1
Source: Krishnan et al (2002), p 40
Population group differences
Groups with higher than average prevalence of lower living standards include sole parent families (51 percent), families who rely on income-tested benefits (57 percent), families with dependent children (particularly larger families), Māori and Pacific people (39 percent and 42 percent, respectively), and those living in rented dwellings. Dependent children are more at risk of low living standards than the population average. The probability of having low living standards declines with age, except for a slight increase during peak child-rearing years.
Table EC4.1 Proportion of population and economic families with lower living standards (ELSI Levels 1-3), 2000
| Percent | |
|---|---|
| Total Population | 20 |
| Males | 18 |
| Females | 21 |
| Total economic families | 18 |
| Age Groups | |
| Dependent children (under 18 years) | 29 |
| 18-24 years | 16 |
| 25-44 years | 19 |
| 45-64 years | 16 |
| 65 years and over | 7 |
| Economic families | |
| With one dependent child | 25 |
| With two dependent children | 24 |
| With three dependent children | 35 |
| Sole parent family | 51 |
| Two parent family | 18 |
| Economic families | |
| With any Māori members | 39 |
| With any Pacific members | 42 |
| With any European/Pākehā members | 15 |
| With any 'Other' ethnic group members | 22 |
| Economic families with main soure of income | |
| New Zealand Superannuation | 7 |
| Income-tested Social Welfare benefits | 57 |
| Market income | 14 |
| Housing Tenure | |
| Rented - Housing New Zealand | 63 |
| Rented - Private | 33 |
| Rented Local Authority | 30 |
| Owned with mortgage | 22 |
| Owned without mortgage | 8 |
Source: Krishnan et al (2002) |
|
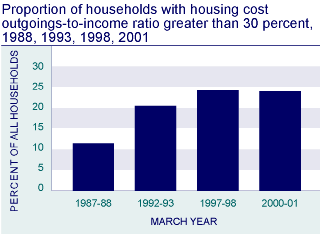
Housing affordability
Definition: The proportion of households spending more than 30 percent of their income on housing.
Relevance: Affordable housing is an important factor in the wellbeing of individuals and families. High housing costs relative to income are often associated with severe financial difficulty, especially among low-income households, and can leave such households with insufficient income to meet other basic needs such as food, clothing, transport, medical care and education.
Current Level and Trends
In 2001, 24 percent of households spent more than 30 percent of their income on housing costs.
Since the late 1980s, there has been a substantial increase in the proportion of households spending more than 30 percent of their income on housing. Between 1988 and 1993 the proportion rose from 11 percent to 20 percent of households, reaching just over 24 percent in 1998. This is partly due to immigration and rising average incomes increasing the demand for housing and pushing prices up.
Figure EC5.1
Source: Statistics New
Zealand Household Economic Survey, Ministry of Social Development
Note: The weightings of the records in the sample have been revised for
all years since The Social Report 2001
High housing costs relative to household income are of greatest concern in respect of low-income households. Analysis of data on those households in the lowest 20 percent of the (equivalised) household income distribution shows a similar increasing trend over the 1988-2001 period but with significantly higher proportions of households spending more than 30 percent of income on housing.35 In 2001, 42 percent of households in the lowest fifth of the household income distribution spent more than 30 percent of their income on housing. This has increased from 16 percent in 1988.
It is important to remember this indicator will include some people whose high housing outgoings or low incomes represent only a temporary state of affairs, as, for example, they choose to make high mortgage repayments, or are temporarily out of work or in full-time study.
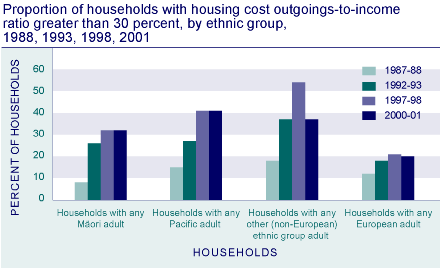
Ethnic Differences
Housing costs in excess of 30 percent are much more common in households that include at least one non-European adult than they are in those where all adults are European. Furthermore, this difference widened over the period between 1988 and 1998. For households with at least one Māori adult, the proportions increased from eight percent in 1988 to 26 percent in 1993 and to 32 percent in 1998, remaining at that level in 2001. For those households containing at least one Pacific adult the increases have been greater, from 15 percent in 1988 to 43 percent in 1998 and 2001.
Among households that include at least one adult in the 'Other' ethnic group, the proportion with housing costs greater than 30 percent of income increased from 37 percent in 1993 to 54 percent in 1998. This increase is likely to be due in part to the increase in the number of new migrants over that period. By 2001, however, the proportion had dropped back to 37 percent.
Figure EC5.2
Source: Derived from
Statistics New Zealands Household Economic Survey by Ministry of Social
Development
Note: The weightings of the records in the sample have been revised for
all years since The Social Report 2001
Household crowding
Definition: The proportion of the population living in crowded housing (ie requiring one or more additional bedrooms, as defined by the Canadian Crowding Index).
Relevance: Housing space adequate to the needs and desires of a family is a core component of quality of life. The Canadian Crowding Index is a proxy measure to monitor incidence of 'crowding' in the population.
National and international studies indicate an association between the prevalence of certain infectious diseases and crowding36 as well as between crowding and poor educational attainment. Crowding can also contribute to psychological stress for people in the households concerned.
Current Level and Trends
In 2001, 108,900 people, or 3.2 percent of the New Zealand resident population, lived in households requiring two or more additional bedrooms. A further 239,500 people (6.9 percent) required just one further bedroom. In total, 348,400 people (10.1 percent) lived in households requiring at least one more bedroom to accommodate household members adequately, based on the criteria in the Canadian Crowding Index (see appendix).
In the five years to 2001, the number of people living in households requiring two or more bedrooms declined by around 6,000; there were 115,300 people (3.4 percent) in that situation in 1996.
Figure EC6.1
Source: Statistics New
Zealand (1998c)
Age and Sex Differences
Household crowding is more likely to be experienced by younger people than older people. In 2001, 17 percent of children under the age of 10 years lived in households requiring at least one more bedroom, compared to 15 percent of 10-14 year olds. Among all adults aged 15 and over, eight percent lived in crowded households but this ranged from 16 percent of 15-24 year olds, to nine percent of 25-44 year olds, five percent of 45-64 year olds, and just two percent of those aged 65 and over.
In 1996, just over 50,000 children under 18 (5.3 percent of all children under 18) were living in households which required two or more additional bedrooms.37 In 2001, 42,900 dependent children (under 18 and not employed full-time) were in this situation, accounting for 4.8 percent of all dependent children.
There is almost no sex difference in the likelihood of living in crowded households, except at ages 25-44, where females are slightly more likely than males to live in households requiring at least one extra bedroom (10 percent, compared to nine percent).
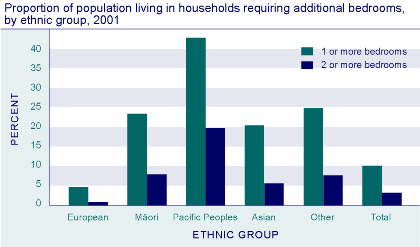
Ethnic Differences
Pacific people are far more likely to be living in crowded households than other ethnic groups. In 2001, a total of 43 percent of Pacific people lived in households requiring extra bedrooms (20 percent requiring two or more; 23 percent just one more). Other ethnic groups were the next most likely, with 25 percent requiring at least one extra bedroom, followed by Māori (23 percent) and Asians (20 percent). Partly reflecting their older age profile, only five percent of European New Zealanders were living in houses that met the definition of crowding used here.
The largest group of those living in households requiring at least one extra bedroom were those who identified as European (38 percent), followed by Māori (34 percent), Pacific people (28 percent), Asian (14 percent) and Other ethnic groups (just two percent).38 However, of those living in more severe crowding situations (households requiring two or more bedrooms), Pacific people and Māori made up the largest groups (41 percent and 38 percent, respectively).
Cultural attitudes and economic conditions are two primary factors which account for the extreme variation in crowding levels between ethnic groups. The variance in population age structures is also a factor: both Māori and Pacific peoples ethnic groups have younger age structures than the European population.
Regional Differences
There is considerable regional variation in household crowding. Whether measured by population or household, Manukau City has by far the highest level of household crowding (24 percent of people, 13 percent of households required one or more bedrooms in 2001). The next highest levels were in Opotiki District and Porirua City, where almost one in five people, and one in 10 households required at least one more bedroom. Other local authority areas with relatively high levels of crowding were Auckland City and the Far North, Wairoa and Kawerau Districts. All of the South Island local authorities had lower than average levels of household crowding.
Socio-Economic Differences
Unemployed people are more likely to be living in crowded households than those with full-time jobs (20 percent and six percent, respectively). Other groups with crowding levels above the average adult level of eight percent include those with no qualifications (ten percent) and those who receive income support (16 percent).39
There is a clear correlation between levels of income and levels of crowding: in 2001, six percent of households in the bottom quartile of equivalised household income required one or more bedrooms, compared with two percent of those in the top income quartile.
Households in rental accommodation were more likely to be crowded (11 percent) than those in dwellings owned with a mortgage (four percent) or mortgage-free (two percent).