Paid work
Employment
Definition
The proportion of the population aged 15–64 years who were employed for at least one hour per week.
RelevanceTop
The employment rate is the best available indicator of the prevalence of paid employment. Like the unemployment rate, it is affected by a number of factors including economic conditions and the availability of work, migration flows, skill levels, family responsibilities, and personal decisions such as undertaking full-time study.
Current level and trendsTop
In the year ended December 2014, 74.2 percent of 15–64 year olds (or 2,175,600 people) were employed, an increase from 72.8 percent (or 2,105,600 people) in the year ended December 2013.
Over the period of the survey, the employment rate reached a peak of 75.1 percent in 2007 (2,098,300 employed people). The lowest employment rate recorded was 64.9 percent in 1992. The employment rate decreased from 2007 to a low of 72.0 percent in 2012 but has since improved. The impact of the 2008 Global Financial Crisis is evident in the time series.
There has been a shift over the period of the Household Labour Force Survey (HLFS) in terms of full-time (30 hours or more per week) and part-time employment. The ratio between full-time and part-time work moved from 5.1 in 1986 to 3.7 in 2014, reflecting reducing proportions of full-time employed and increasing proportions of part-time employed. This change was most pronounced between 1986 and 1992, but has since fluctuated. In 2014, the proportion of people seeking full-time employment was 58.6 percent of the working-age population, and the proportion of people seeking part-time employment (less than 30 hours per week) was 15.7 percent.
Figure PW2.1 – Employment rate, 1986–2014
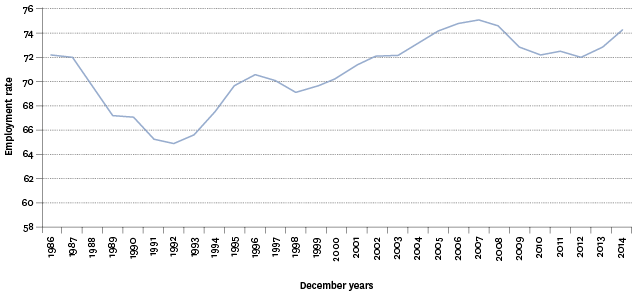
Source: Statistics New Zealand, Household Labour Force Survey
Note: Average for December years.
Age and sex differencesTop
Those aged 45–54 years consistently had the highest employment rate (84.1 percent in 2014), followed by 35–44 year olds (82.8 percent) and 25–34 year olds (78.1 percent).
The employment rate for those aged 15–24 years and 55–64 years has remained consistently low over the period of the survey (the rates in 2014 were 51.7 and 76.2 percent respectively). The employment rate for 15–24 year olds has generally been on the decline since 1986 and was impacted the most by the Global Financial Crisis, dropping 9.4 percentage points between 2007 and 2012. In comparison, the decline between 2007 and 2012 for 15–64 year olds was 3.1 percentage points, dropping from 75.1 to 72.0 percent. While 55–64 year olds have the next lowest employment rate, their rates have increased since 1986, rising from 49.0 percent to 76.2 percent in 2014. This reflects the rise in the age of eligibility for New Zealand Superannuation during this period and changing labour market patterns. The employment rate for those aged 65–74 has also shown a steady increase, moving from 11.6 percent in 1986 to 31.1 percent in 2014.
Males have consistently had a higher employment rate than females over the period of the survey. In 2014, males again had the higher rate (79.7 percent, compared with 69.1 percent for females). This is mainly because women spend more time on childcare and other unpaid household work, and are more likely than men to undertake some form of study or training. However, the sex difference in the employment rate more than halved between 1986 and 2014, from 24.5 percentage points to 10.6 percentage points. Over the period of the survey and ignoring the impact of economic fluctuations, male employment rates have been declining, while female rates have increased.
Table PW2.1 – Employment rate, by age group and sex, selected years 1986–2014
| Year | 15–24 | 25–34 | 35–44 | 45–54 | 55–64 | Male 15–64 | Female 15–64 | Total 15–64 | 65–74 |
|---|---|---|---|---|---|---|---|---|---|
| 1986 | 68.5 | 75.2 | 84.0 | 79.3 | 49.0 | 84.5 | 60.0 | 72.2 | 11.6 |
| 1991 | 54.4 | 69.0 | 78.9 | 77.0 | 41.5 | 73.5 | 57.2 | 65.3 | 8.3 |
| 1996 | 58.8 | 74.2 | 79.4 | 81.0 | 53.6 | 78.5 | 62.9 | 70.6 | 9.6 |
| 2001 | 55.3 | 74.5 | 80.1 | 82.1 | 60.3 | 78.6 | 64.4 | 71.4 | 13.3 |
| 2006 | 58.0 | 78.2 | 82.0 | 84.7 | 70.0 | 81.9 | 68.0 | 74.8 | 20.7 |
| 2007 | 58.0 | 79.1 | 81.9 | 84.3 | 71.8 | 82.0 | 68.6 | 75.1 | 22.8 |
| 2008 | 55.8 | 79.0 | 81.8 | 84.3 | 71.6 | 80.9 | 68.6 | 74.6 | 24.5 |
| 2009 | 51.1 | 76.7 | 81.0 | 83.3 | 72.0 | 78.6 | 67.3 | 72.8 | 25.3 |
| 2010 | 49.4 | 75.0 | 80.8 | 83.2 | 73.2 | 78.2 | 66.5 | 72.2 | 26.5 |
| 2011 | 49.2 | 77.0 | 80.1 | 83.7 | 73.6 | 78.3 | 67.1 | 72.5 | 29.0 |
| 2012 | 48.6 | 75.9 | 80.0 | 82.7 | 73.8 | 77.4 | 66.8 | 72.0 | 30.2 |
| 2013 | 49.2 | 77.5 | 80.8 | 83.8 | 74.3 | 78.3 | 67.7 | 72.8 | 31.1 |
| 2014 | 51.7 | 78.1 | 82.8 | 84.1 | 76.2 | 79.7 | 69.1 | 74.2 | 31.1 |
Source: Statistics New Zealand, Household Labour Force Survey
Note: Average for December years.
In terms of full-time and part-time employment and changes over time, there are marked differences by sex. The male full-time employment rate in 2014 was 71.3 percent and the part-time rate was 8.4 percent. The female full-time employment rate was much lower at 46.5 percent and the part-time rate higher at 22.6 percent. In 1986, the ratio between full-time and part-time employment for males was 17.8 but declined significantly to 8.5 in 2014, reflecting a shift by males to part-time work. In contrast, the ratio for females remained the same at 2.1 in 1986 and 2014, reflecting that the rise in the female employment rate has impacted on both full-time and part-time employment.
Ethnic differencesTop
There are marked differences in employment rate by ethnicity. In 2014, the European/Other employment rate was highest at 78.5 percent, followed by the Asian ethnic group (68.1 percent), Māori (62.7 percent) and Pacific peoples (58.3 percent).
The Māori employment rate peaked at 65.6 percent in 2008 and reached a low of 46.4 percent in 1992. The Māori employment rate in 2014 was 62.7 percent, an increase from 60.1 percent at the same time the previous year. The Pacific peoples’ employment rate peaked at 68.5 percent in 1986 and reached a low of 45.9 percent in 1991. The Pacific peoples’ employment rate in 2014 was 58.3 percent, an increase from 55.0 percent at the same time the previous year.
The European/Other employment rate peaked at 78.5 percent in 2014 and reached a low of 68.2 percent in 1992. The European/Other employment rate in 2014 was 78.5 percent, an increase from 77.5 percent at the same time the previous year. The Asian employment rate peaked at 76.3 percent in 1987; it reached a low of 49.1 percent in 1998. The Asian employment rate in 2014 was 68.1 percent, an increase from 65.9 percent at the same time the previous year.
As noted, youth experience lower employment rates. This is a particular concern for Māori and Pacific peoples who have relatively youthful populations. In 2014, for those aged 15–24 years, Pacific peoples, Māori, people in the Asian group and European/Others had employment rates of 34.6, 45.5, 44.0 and 57.7 percent respectively.
Figure PW2.2 – Employment rate, by ethnic group, 1986–2014
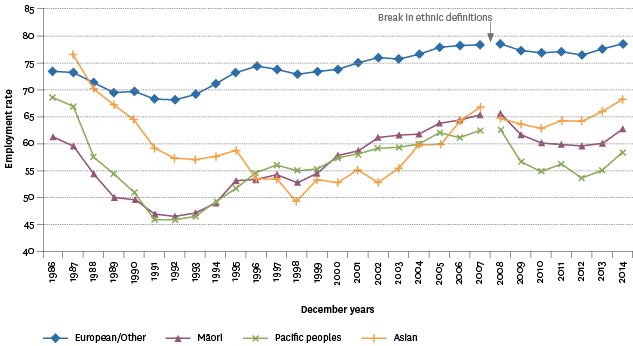
Source: Statistics New Zealand, Household Labour Force Survey
Notes: Average for December years. For 2007 and earlier people are counted in only one ethnic group (ethnicities are prioritised). From 2008 people can be counted in more than one ethnic group (total response). Caution should be used when comparing the two ethnic series over time.
Regional differencesTop
Canterbury had the highest employment rate at 80.1 percent for the year ended December 2014, while Northland had the lowest employment rate at 69.5 percent.
International comparisonTop
In 2014, the New Zealand employment rate of 74.2 percent was ranked 5th highest out of 34 OECD countries. This was higher than the OECD median of 68.0 percent and compares with a rate of 71.6 percent in Australia, 71.9 percent in the United Kingdom, and 68.1 percent in the United States. Iceland had the highest employment rate at 81.6 percent, while Greece had the lowest at 49.4 percent.
Data for this section can be found at: www.socialreport.msd.govt.nz/documents/2016/PW2.xlsx
