Social connectedness
Contact between young people and their parents
Definition
The proportion of secondary school students aged 12–18 years who said they got enough time with mum and/or dad (or someone who acts as mum and/or dad) most of the time.
RelevanceTop
Current level and trendsTop
About half of the students (49 percent) felt they got enough time with their mothers most of the time, while fewer students (37 percent) felt they got enough time with their fathers most of the time.
Of those students who did not get enough time with their parents, the most common reason reported was that the parent was at work. Seventy-one percent of students who lacked time with their fathers gave this reason, as did 62 percent of students who lacked time with their mothers. Other common reasons were that the parent was busy with housework, other children or family members (particularly mothers, 50 percent); that the parent was out; or that the parent was not living with them (particularly fathers, 22 percent and 27 percent respectively).
Sex differencesTop
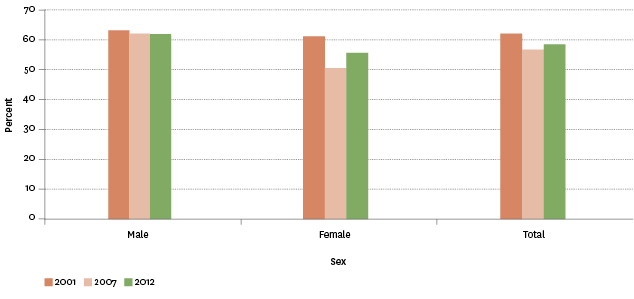
In 2012, more male students (62 percent) than female students (55 percent) reported that most of the time they got enough time with at least one of their parents. This difference between male and female students was also found in 2007 (62 percent and 50 percent respectively), but not in 2001.
The proportion of female students who reported that they got enough time with at least one of their parents fell between 2001 and 2007, but rose again in 2012. However, there was no real change for male students over the three survey periods.
Both male and female students were more likely to say they got enough time with their mothers than with their fathers. Females (33 percent) were less likely to report getting enough time with their fathers when compared with males (42 percent). There were no real differences between the sexes regarding time spent with mothers.
Figure SC3.1 – Proportion of secondary school students who said they get enough
time with their parent(s) most of the time, by sex, 2001–2012
Source: Adolescent Health Research Group
Age differencesTop
Younger students were slightly more likely than older students to report that most of the time they got enough time with their mother or father. Across all age groups, students were more likely to report that they got enough time with their mother than with their father.
Table SC3.1 – Proportion of secondary school students who get enough time
with their mother or father most of the time, by age of student, 2012
| Parent | Under 14 | 14 | 15 | 16 | 17+ |
|---|---|---|---|---|---|
| Mother | 52 | 49 | 49 | 47 | 48 |
| Father | 40 | 39 | 36 | 34 | 37 |
Source: Adolescent Health Research Group
Ethnic differencesTop
Socio-economic differencesTop
Fifty–three percent of students living in areas with low levels of deprivation said they got enough time with their mother most of the time, and 40 percent said they got enough time with their father most of the time. For students living in areas with medium levels of deprivation, the figures were 50 percent and 36 percent respectively; and for those living in areas of high deprivation, the figures were 43 percent and 36 percent respectively.
Data for this section can be found at: www.socialreport.msd.govt.nz/documents/2016/sc3.xlsx
